How does the scenario analysis module works?
This article explains how you can use the scenario analysis module to compare the financial statements of different projects or scenarios (such as upside or downside cases), or company actuals vs forecasts.
The Business Plan Shop uses data entered about your business into the financial forecasting software to build this analysis.

How does the scenario analysis module work?
Our software allows you compare two scenarios such as an upside and downside case.
This enable you to analyse the financial impact of a business decision on key performance indicators.
In doing so, you'll realise whether or not it's worth undertaking that initative.
Similarly, you can compare your financial forecast with historical data to make sure that you are on track to deliver your business plan.
If not, you could look to make changes to your business' activities to help reach that goal.
Frequently Asked Questions
- Decide which two projects you want to compare
- Select the company associated with each of those two projects
- You'll now be able to filter and select them as "project 1" and "project 2"
- Choose the date range that you want to compare those two projects in
- Most of the time users will pick the same dates but you could choose two different dates based on the scenario that you want to create
- You can compare data using a monthly, quarterly, yearly or custom date range (this can be adjusted by changing the "frequency"
- Finally, click on compare projects
- You'll now be shown the financial statements for both projects and you can use the variance to compare their figures

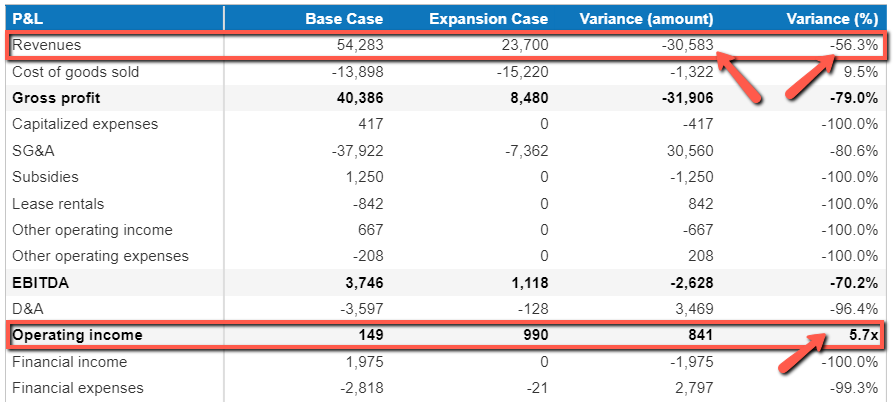
The variance is the difference between the figures of the two projects selected.
For example, if your SG&A for "Project 1" is £10,000 and £15,000 for "Project 2", the variance in amount will be £5,000.
Note that variances will be shown for each individual line in the financial statements.
Our software illustrates the variance between two figures both as an amount and a percentage.
If the variance is above 100%, the software will show it as a multiple instead.
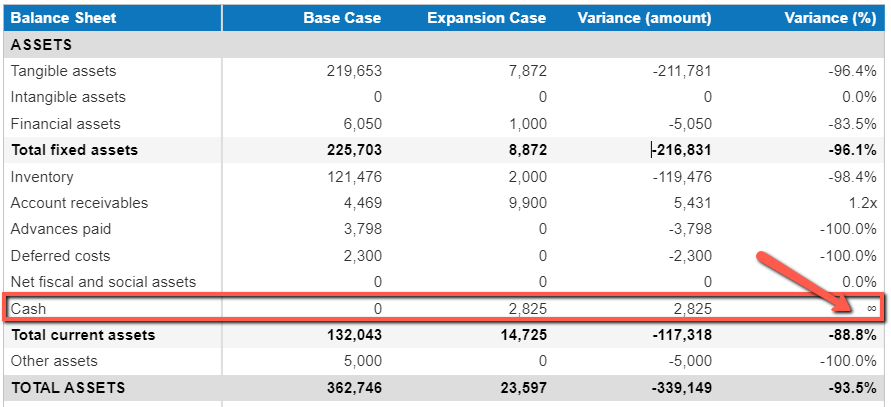
When a figure in one the financial statement lines (cash for example) equates to zero, we cannot use it to find the variance as a percentage.
This is because any figure divided by zero has no definitive answer and hence the infinity sign is shown.
Note that this mostly applies when a figure from the "Project 1" is equal to zero, rather than a figure from "Project 2".
- Firstly, you'll need to create a copy of your project
- This can be done in the "My Projects" module
- Be sure to give the project a clear name
- Next, you should tweak the figures in the financial forecasting software to match your hypothesis (upside case for example)
- This means that you'll now have two scenarios created (base case and upside case)
- Finally, head to the scenario analysis module
- Compare the two scenarios with each other by looking at the variances (base case vs. upside case)
- Repeat the same steps for a downside scenario and then compare that with the base case as well

- First, you'll need to import your actuals data into the software
- Use our data sources module to import your financial data
- Switch back over to the scenario analysis module
- Choose the companies and related projects that you wish to compare
- You can compare both projects using a monthly, quarterly, yearly or custom date range.
- Most of the time users will pick the same dates but you could choose two different dates based on the scenario that you want to create
- Finally, click on compare projects
- You'll now be given the financial statements for both projects and you can use the variance to compare their figures
While comparing two projects, you may have receieved a notification saying:
"Warning: the 2 scenarios use different currencies. Select the output currency and FX rate below"
This happens because your projects each use a different currency.
The software cannot determine the exchange rate between two different currencies at a given date.
Therefore, you'll have to manually enter it in the "output currency" part.
Note: The same applies if you pick the same currency for both projects but use a different symbol (i.e GBP vs £) - so be sure to give both projects that you wish to compare the same symbol.
Go further with The Business Plan Shop
Was this page helpful?