How does the forecast analysis work?
This article explains how you can use the forecast analysis dashboard to help detect issues with your financial forecast.
The Business Plan Shop uses data entered about your business into the financial forecasting software to build this analysis.

How does the forecast analysis dashboard work?
Our software analyses your forecast and looks for issues related to the following areas:
- Growth: to maintain its level of profitability a business revenues need to grow at least as fast as costs are increasing due to inflation. We alert you if your growth seems to low, or too fast (irrealistic)
- Profitability: to be sustainable a business needs to be profitable, we alert you if we detect negative or declining margins
- Working capital: we alert you when we detect anormal payment terms, or insufficient inventory levels.
- Cash generation: to be sustainable a business needs to be generating cash, we alert you if we detect negative cash flows
- Solvability: we look at your cash position and credit metrics and alert you when we find issues that could affect your business' ability to repay its debt over the medium term
- Liquidity: we look at your cash position and financial ratios and alert you when we find issues that could affect your business' ability to pay its short term liabilities
Important: the alerts generated in the dashboard are here to help you identify potential issues with your forecast. They should be used as a guide to sanity check your forecast, but they aren't financial advice. If you want advice tailored to your circomstances you should talk to an accountant or a financial consultant.
You should also note that our algorithm and scoring model are currently geared toward sustainability (stable financial management). If your business is pursuing another strategy, such as a hyper growth at the expense of profitability (VC funded startup for example), or a high leverage to maximise shareholders' return (LBO for example), the alerts generated might be less relevant.
Company Tab
The company tab allows you to view the score and alerts for the entire business.
Business Line Tab(s)
There is an individual tab for each business line where we zoom-in on the growth, profitability and working capital elements of the business line.
Comments & Notes Tab
The comments & notes tab lets you write important notes on each page that may prove useful at a later point.
These notes can be kept private or shared with other users that you have invited on your account.
Frequently Asked Questions
Our algorithm analyses your financial forecast and scores it against a set of quantitative criterias. Your forecast quality score ranges from 1-100.
Generally, the higher the score, the better. But your quality score is not an absolute metric, a forecast with a low score could be viable and, similarly, a high score doesn't guarantee business success. This is especially true if you are comparing forecasts of businesses in different industries.
Your quality score should be used relatively, by that we mean that if your score improves after you made a change in your forecast, that's probably a good change to make. This is especially true if you're testing different business models for a new business or service.
There are three levels of colour coded alerts:
Red
- This signals "danger": it means that there is a financial risk with your forecast which should be remedied if possible
- For example, a negative cash flow
Amber
- This signals "warning": it means that there is a cause for concern that needs to be monitored
- For example, a high seasonality detected
Green
- This signal means "success": it means you scored full points against the quantitative criteria
- For example, gross profit margin is expanding
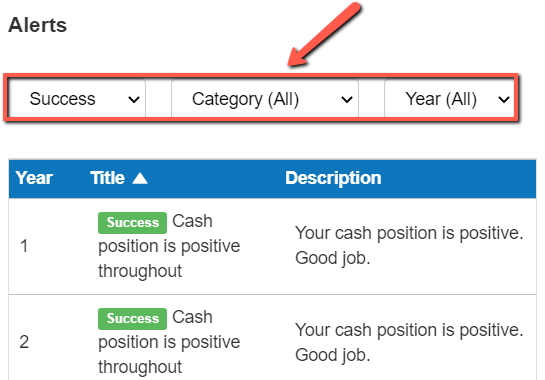
- Simply use the filter bar at the top of the table
![filtering my alerts using the success metric]()
Go further with The Business Plan Shop
Was this page helpful?