How does the landing zone module work?
This article explains how you can use the landing zone module in The Business Plan Shop's financial forecasting software.
How does the landing zone module work?
The landing zone tab
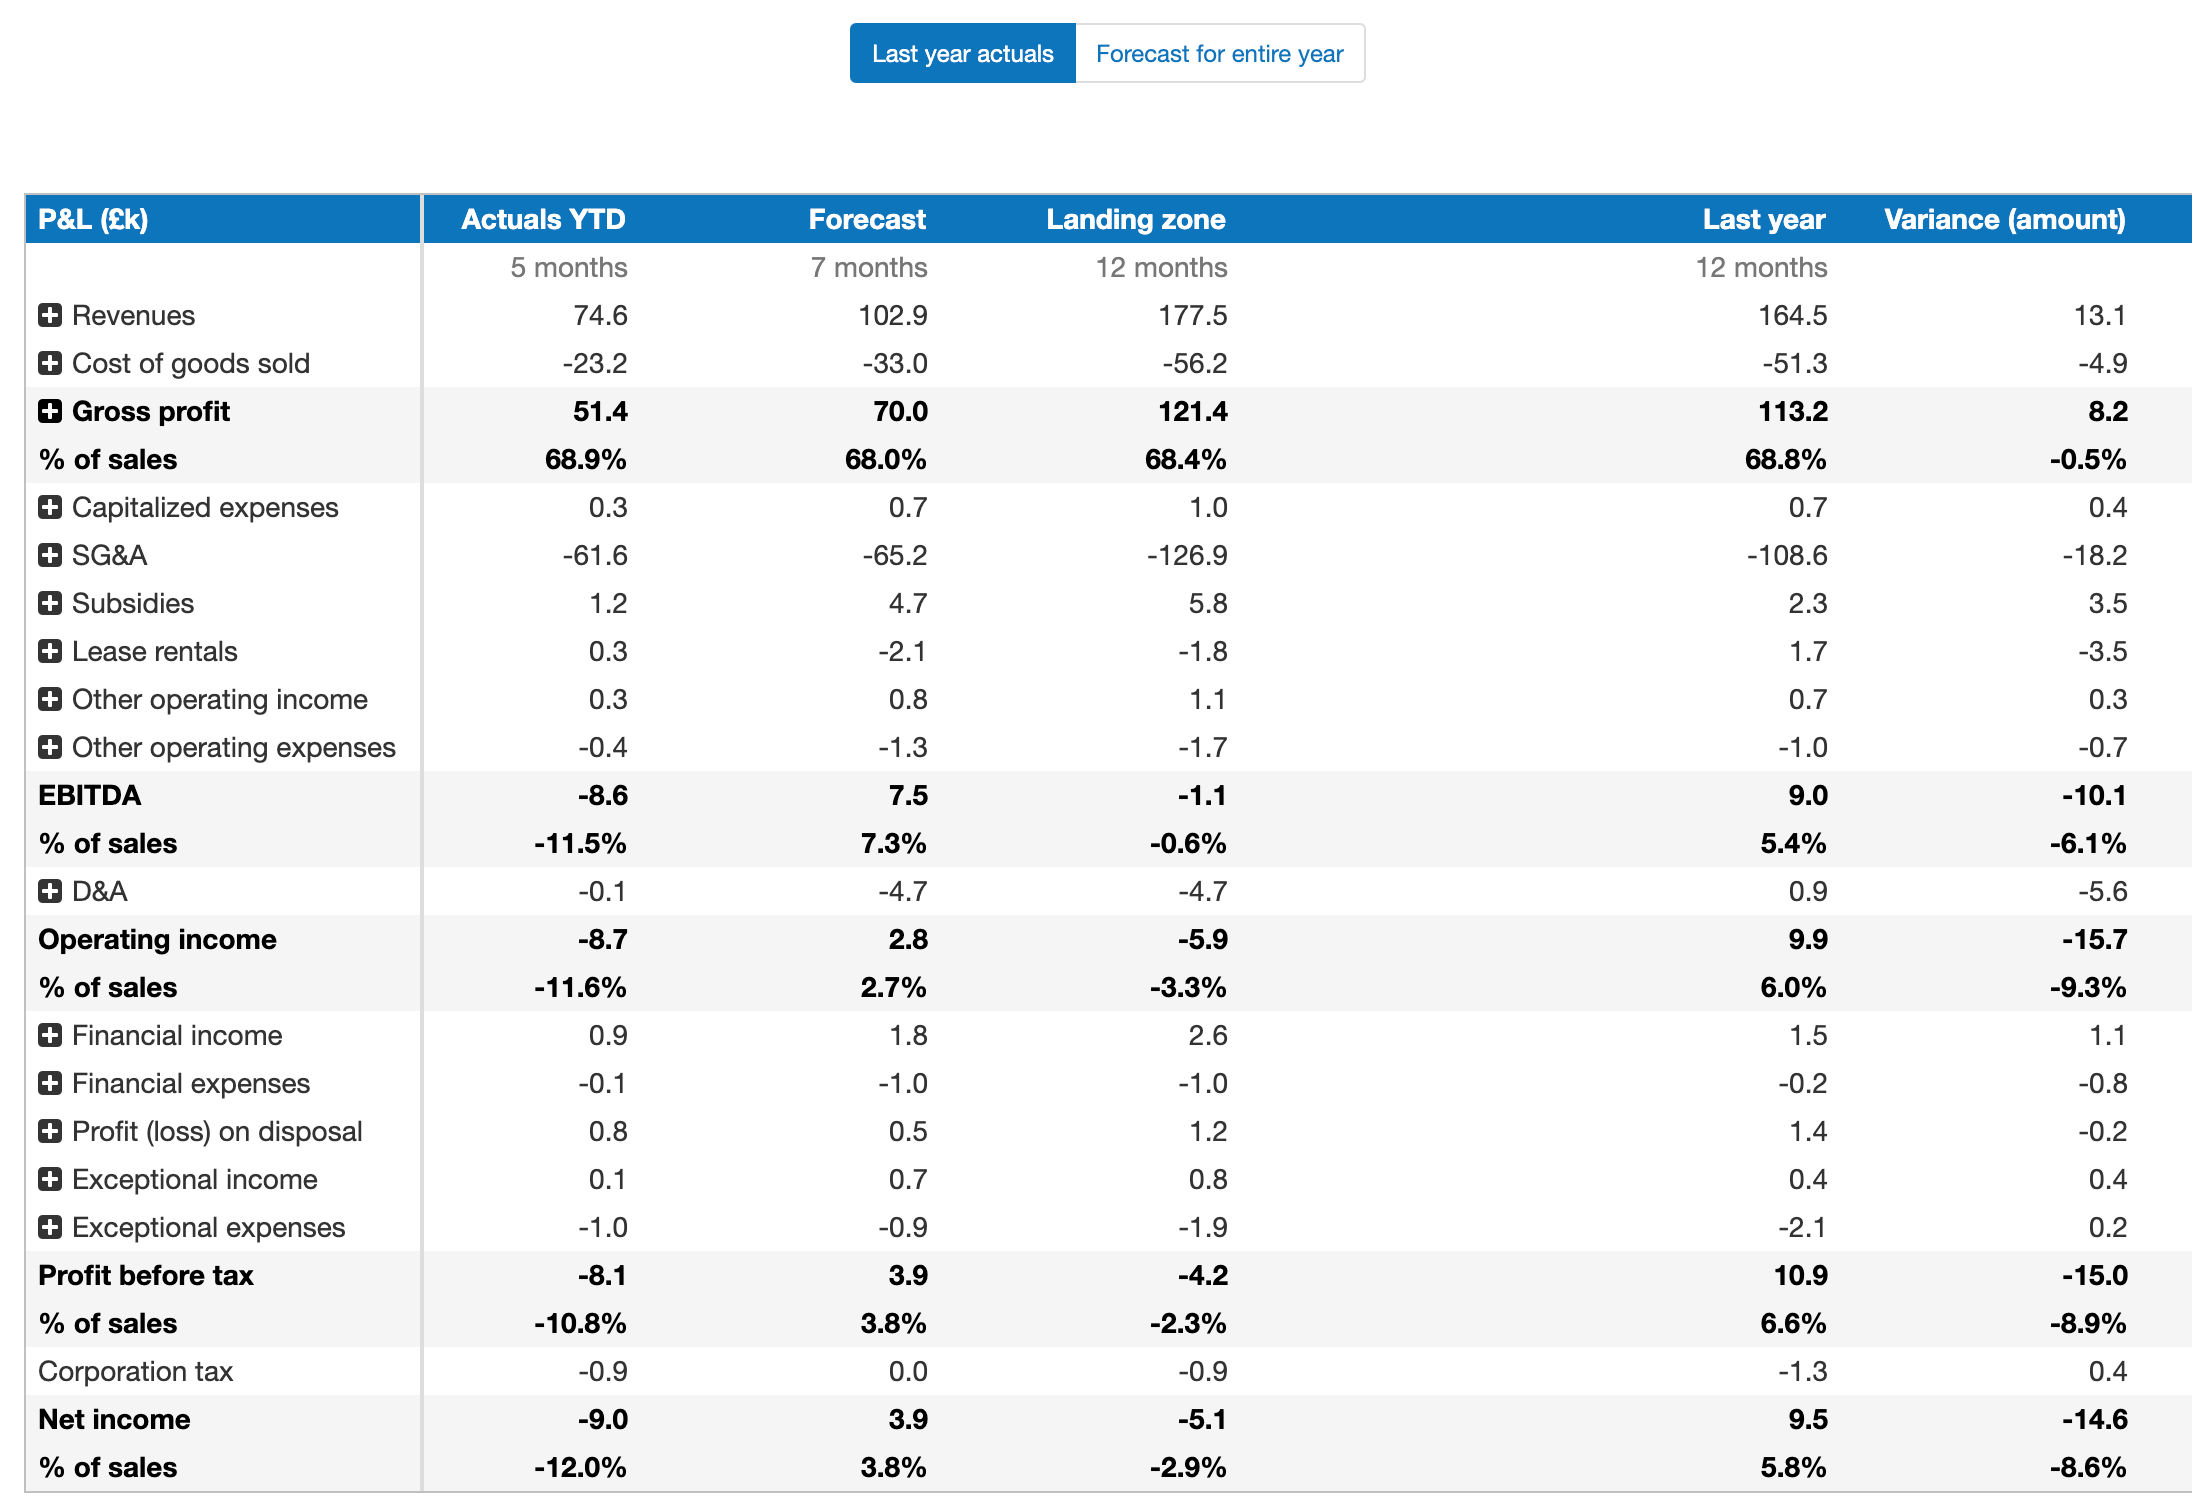
The landing zone tab lets you visualise where your business is going to land in terms of profitability at the end of your current financial year. To create the projection, our dashboard combines your actuals financial data for the year-to-date with your financial forecast for the remainder of the financial year.
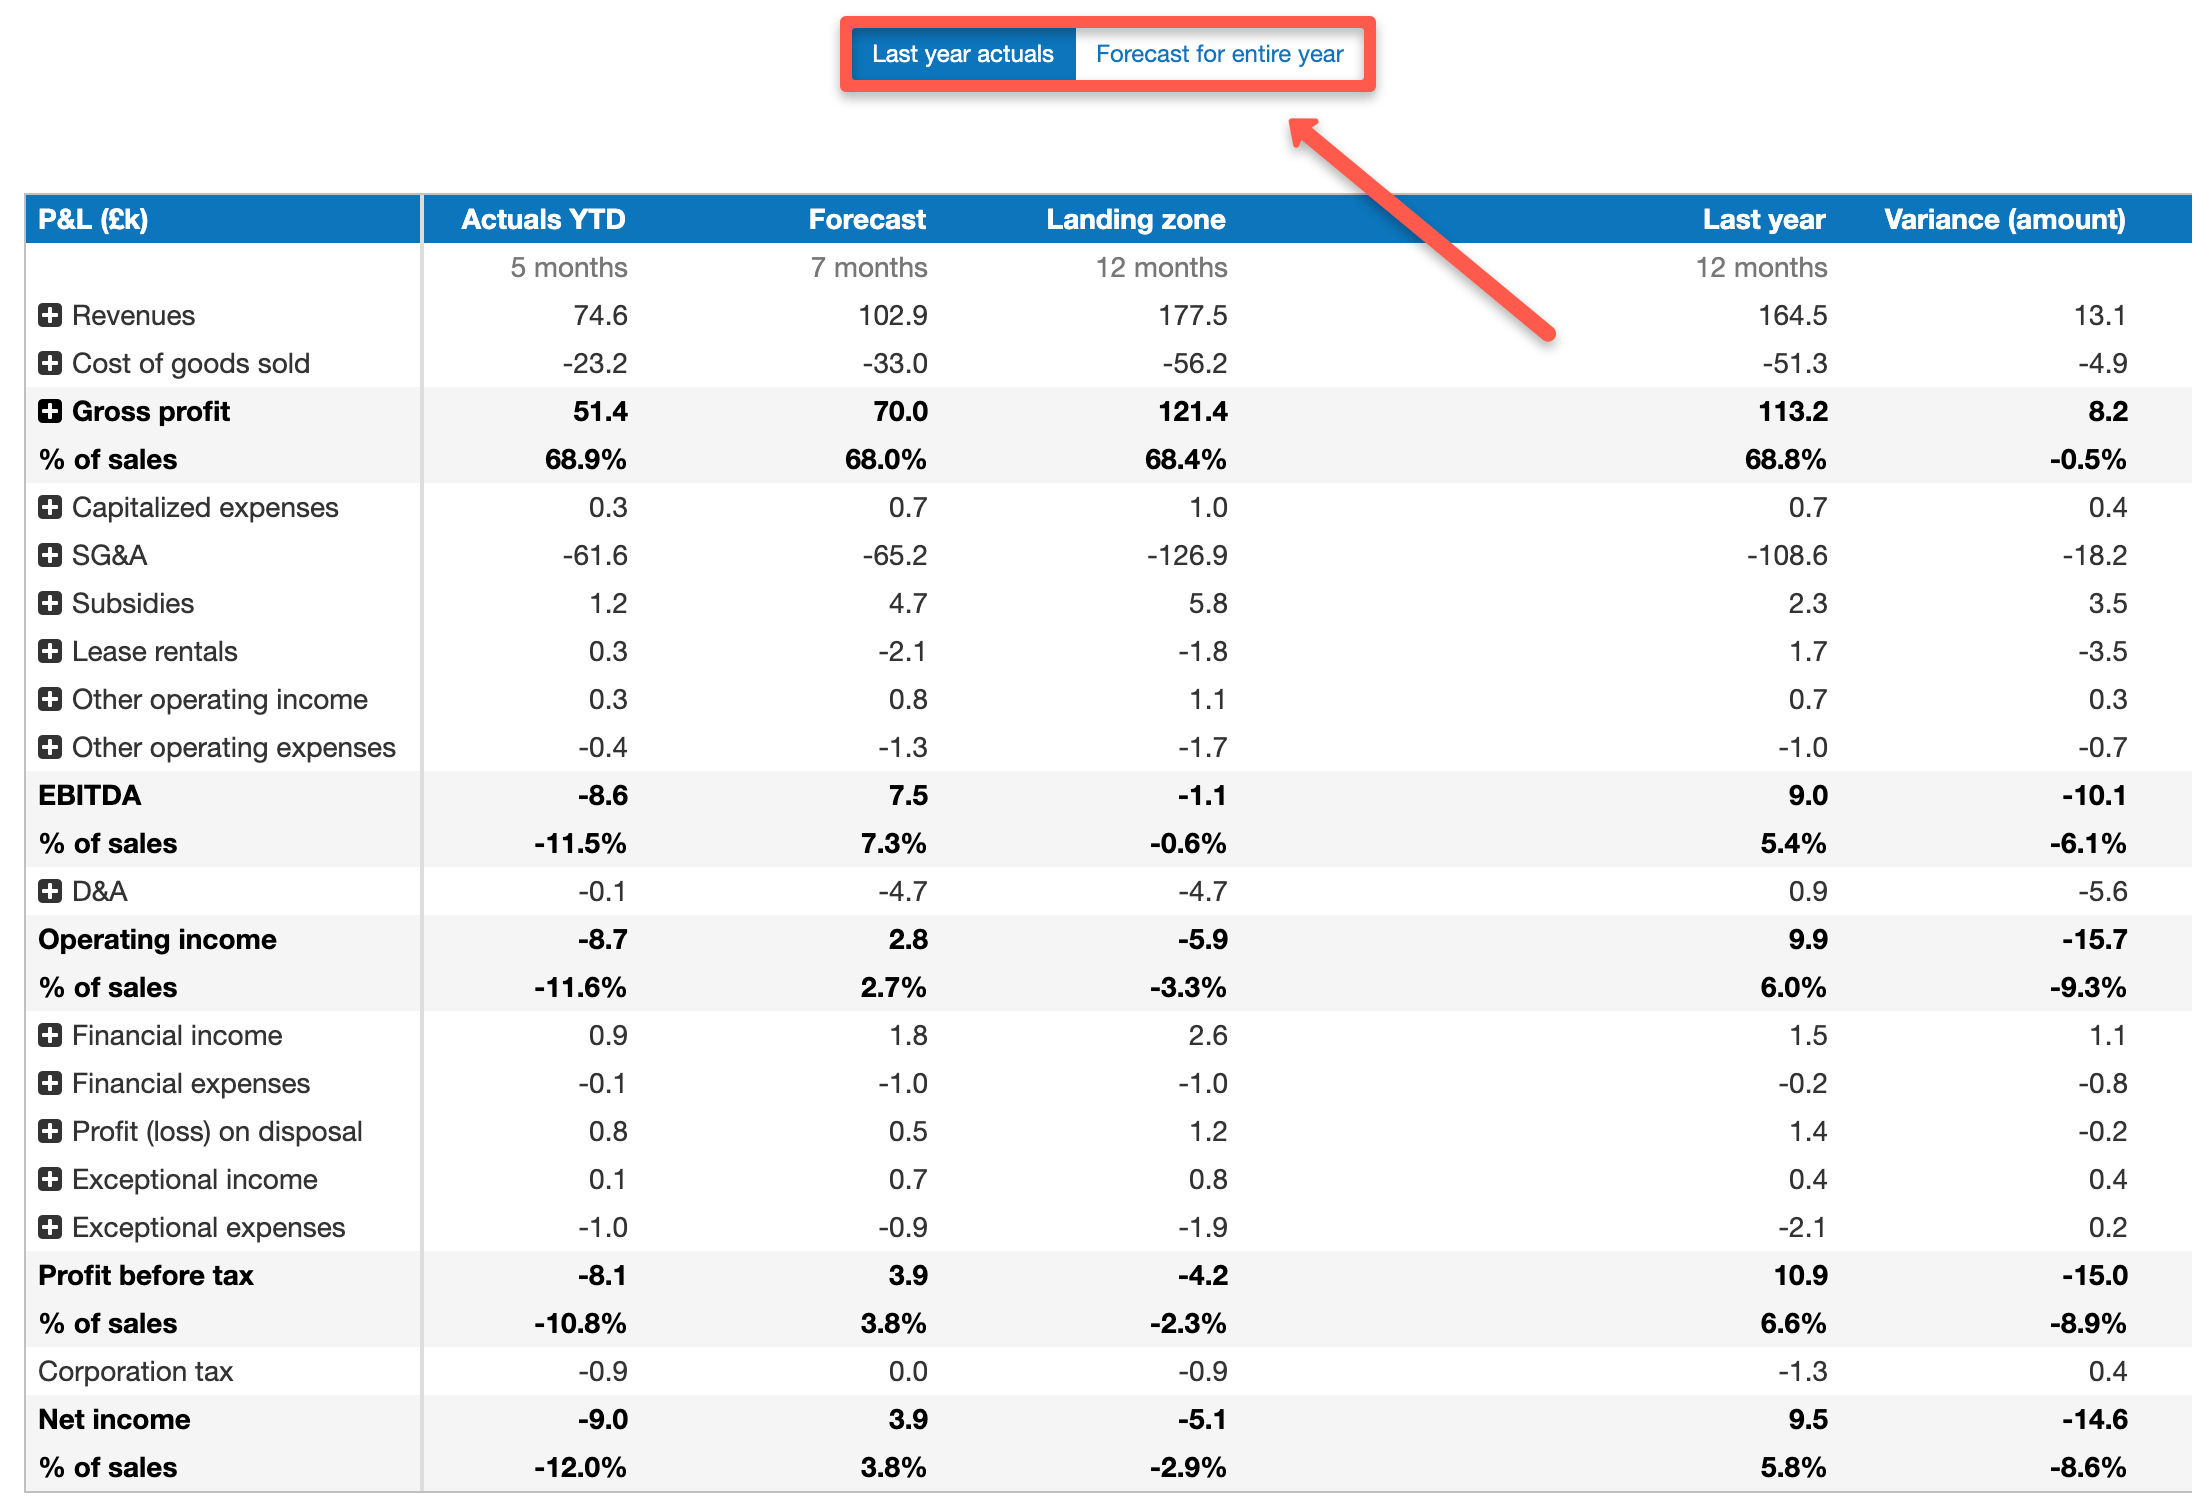
You can then compare this projection to your forecast for the current financial year or last year’s actual performance.
Comments & Notes Tab
The comments & notes tab lets you write important notes on each page that may prove useful at a later point.
These notes can be kept private or shared with other users that you have invited on your account.
Frequently Asked Questions
A landing zone is a projected level of profitability for the current financial year.
This projection is calculated by adding your performance during the year so far (year-to-date) and your forecast for the remaining months until the end of the financial year.
This projection assumes that your financial forecast for the rest of the year has been adjusted to reflect the current financial performance of the business.
Comparing your landing zone data with last year’s actuals allows you to visualise whether or not your business is on the right track in terms of progression. If it’s not, you might want to take action before the end of the current financial year.
Comparing your landing zone data to your forecast for the entire year lets you understand how accurate your forecast is likely to be, come the end of the current financial year. It also lets you decipher whether or not you're on track to meet your KPIs.
The actuals vs. forecast module lets you compare how you performed (actuals data) against your forecast and the previous' year actuals data.
This dashboard doesn't combine actuals and forecasted data to create a projection, it simply compares them.
Last year’s actuals data shows how your business performed in the previous financial year.
The forecast for the entire year is a forecast drawn up at the start of the current financial year to predict your business’s performance over the next 12 months.
You can access your actuals financial data by going onto the historical financial data module.
You can access your forecasted financial data for both the remainder of the financial year and the entire financial year in the “financial forecast” module
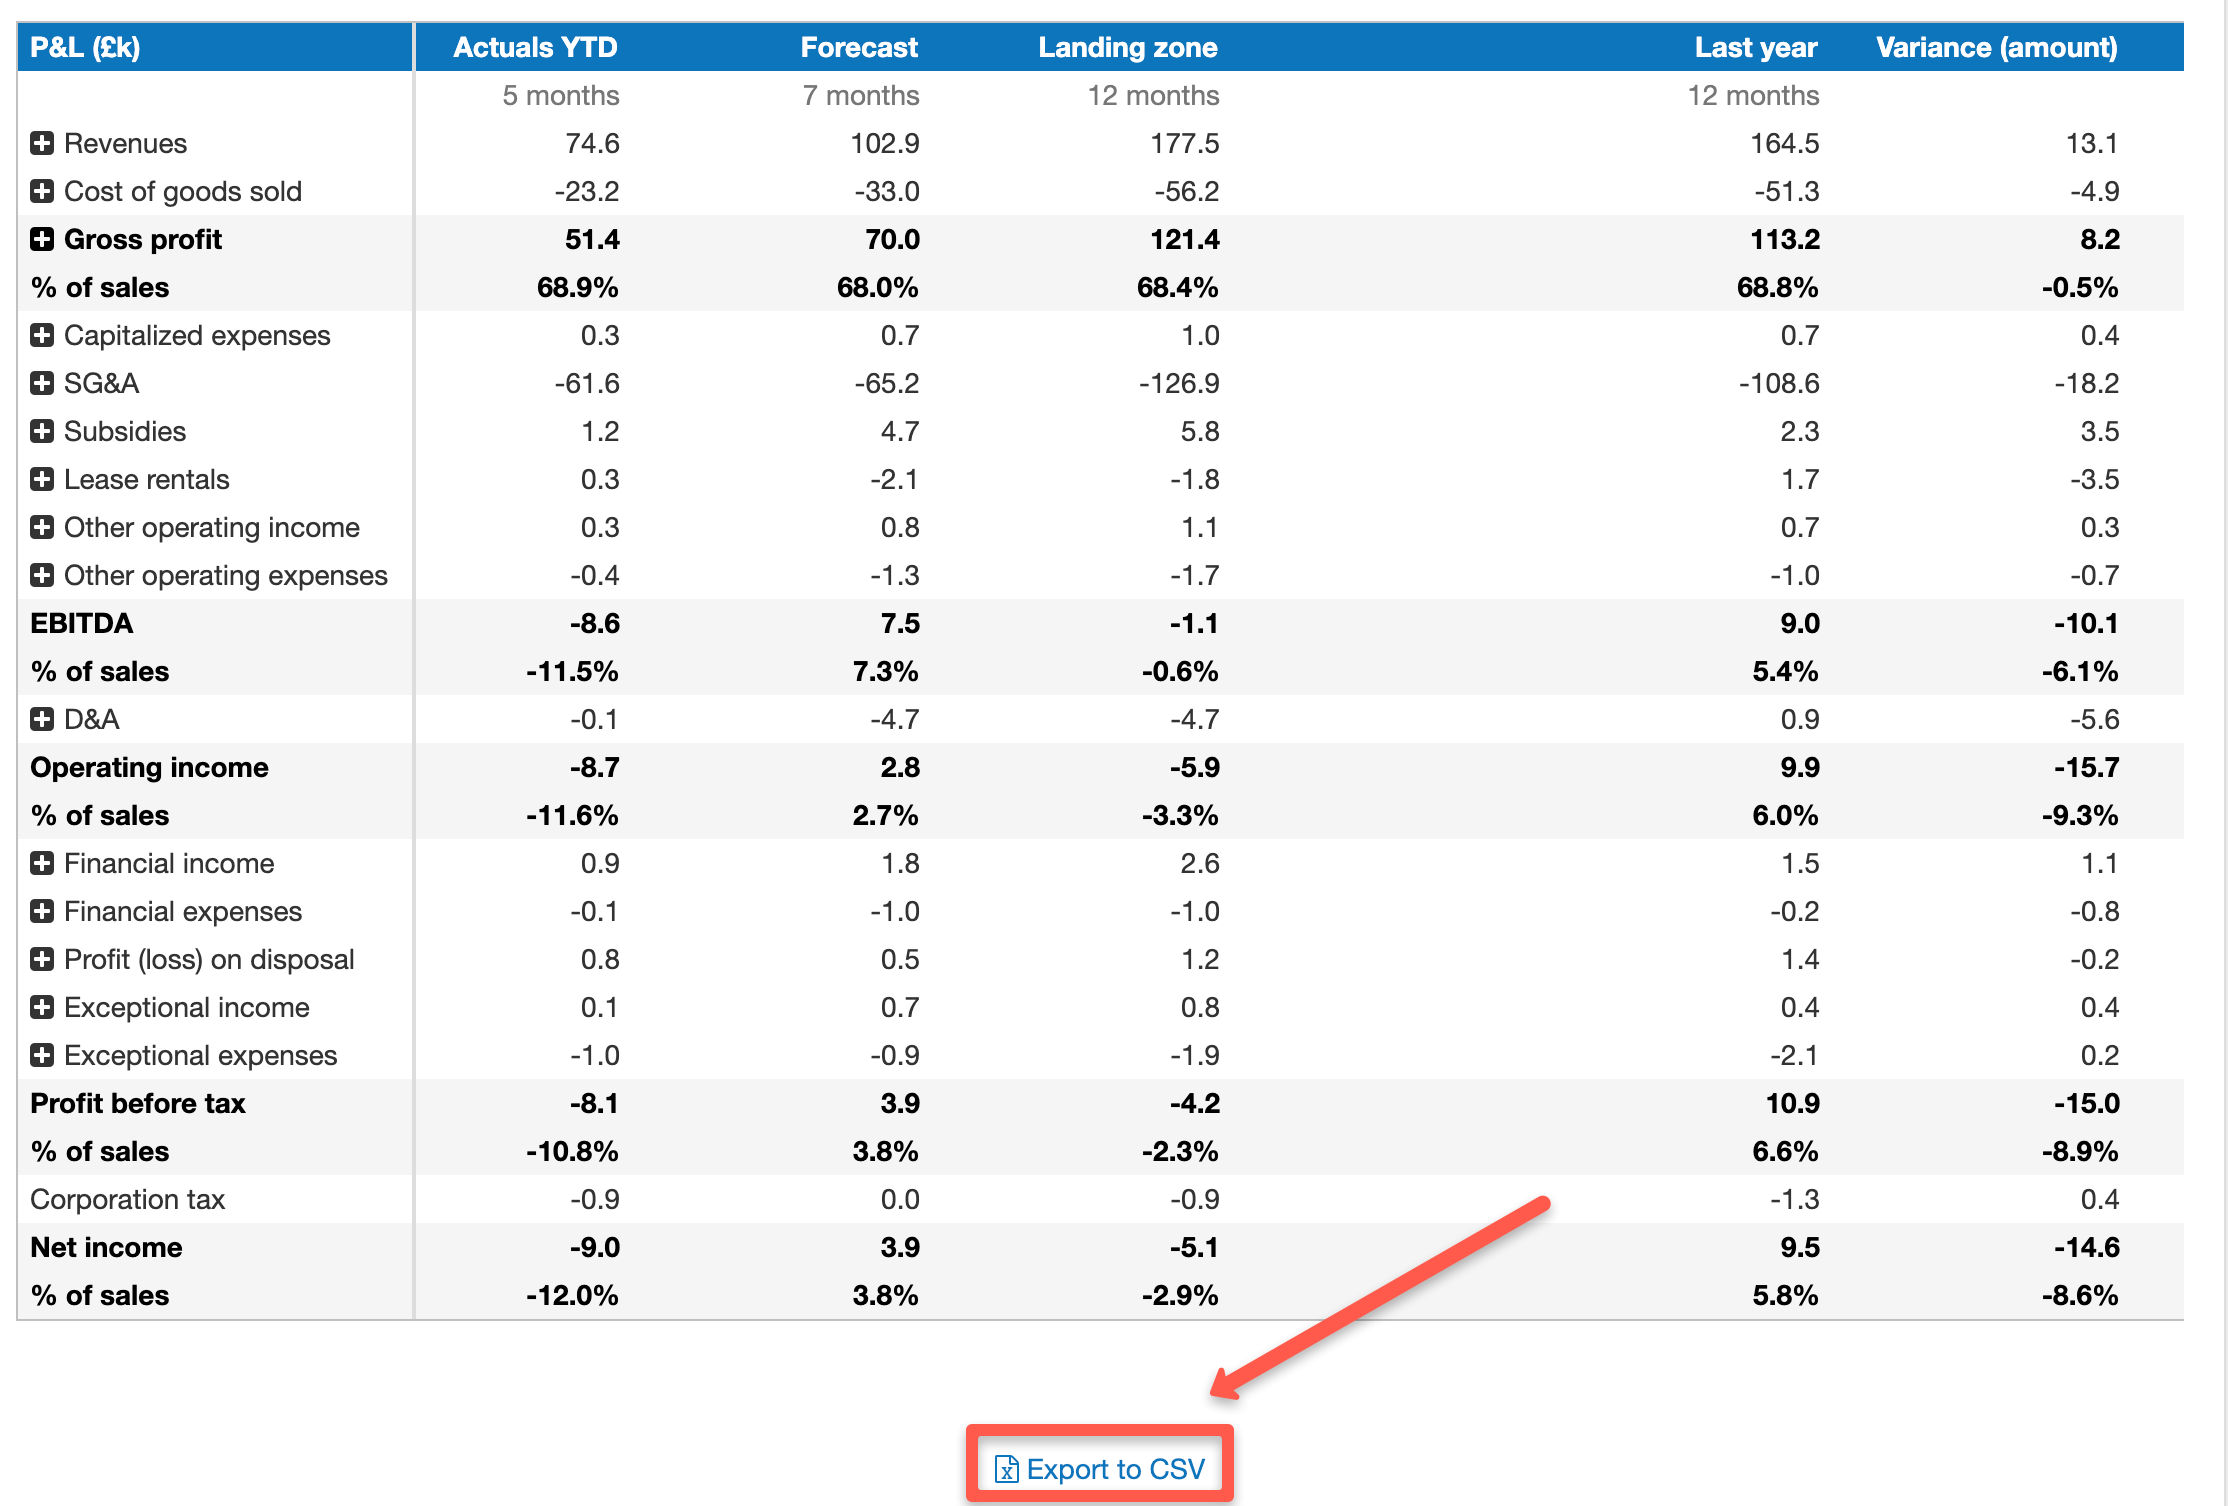
Scroll down to the bottom of the page and click on the “export to CSV” button
The variance is calculated by taking the difference between the landing zone figure and either last year actuals or forecast for the entire year (depending on which you choose to compare the data with).
This variance is calculated for each individual line in the P&L.
The actual difference between the figures is shown as is the percentage difference between the two figures.
Go further with The Business Plan Shop
Was this page helpful?