How does the actuals vs. forecast module work?
This article explains how you can use the actuals vs. forecast module in The Business Plan Shop's financial forecasting software.
How does the actuals vs. forecast module work?
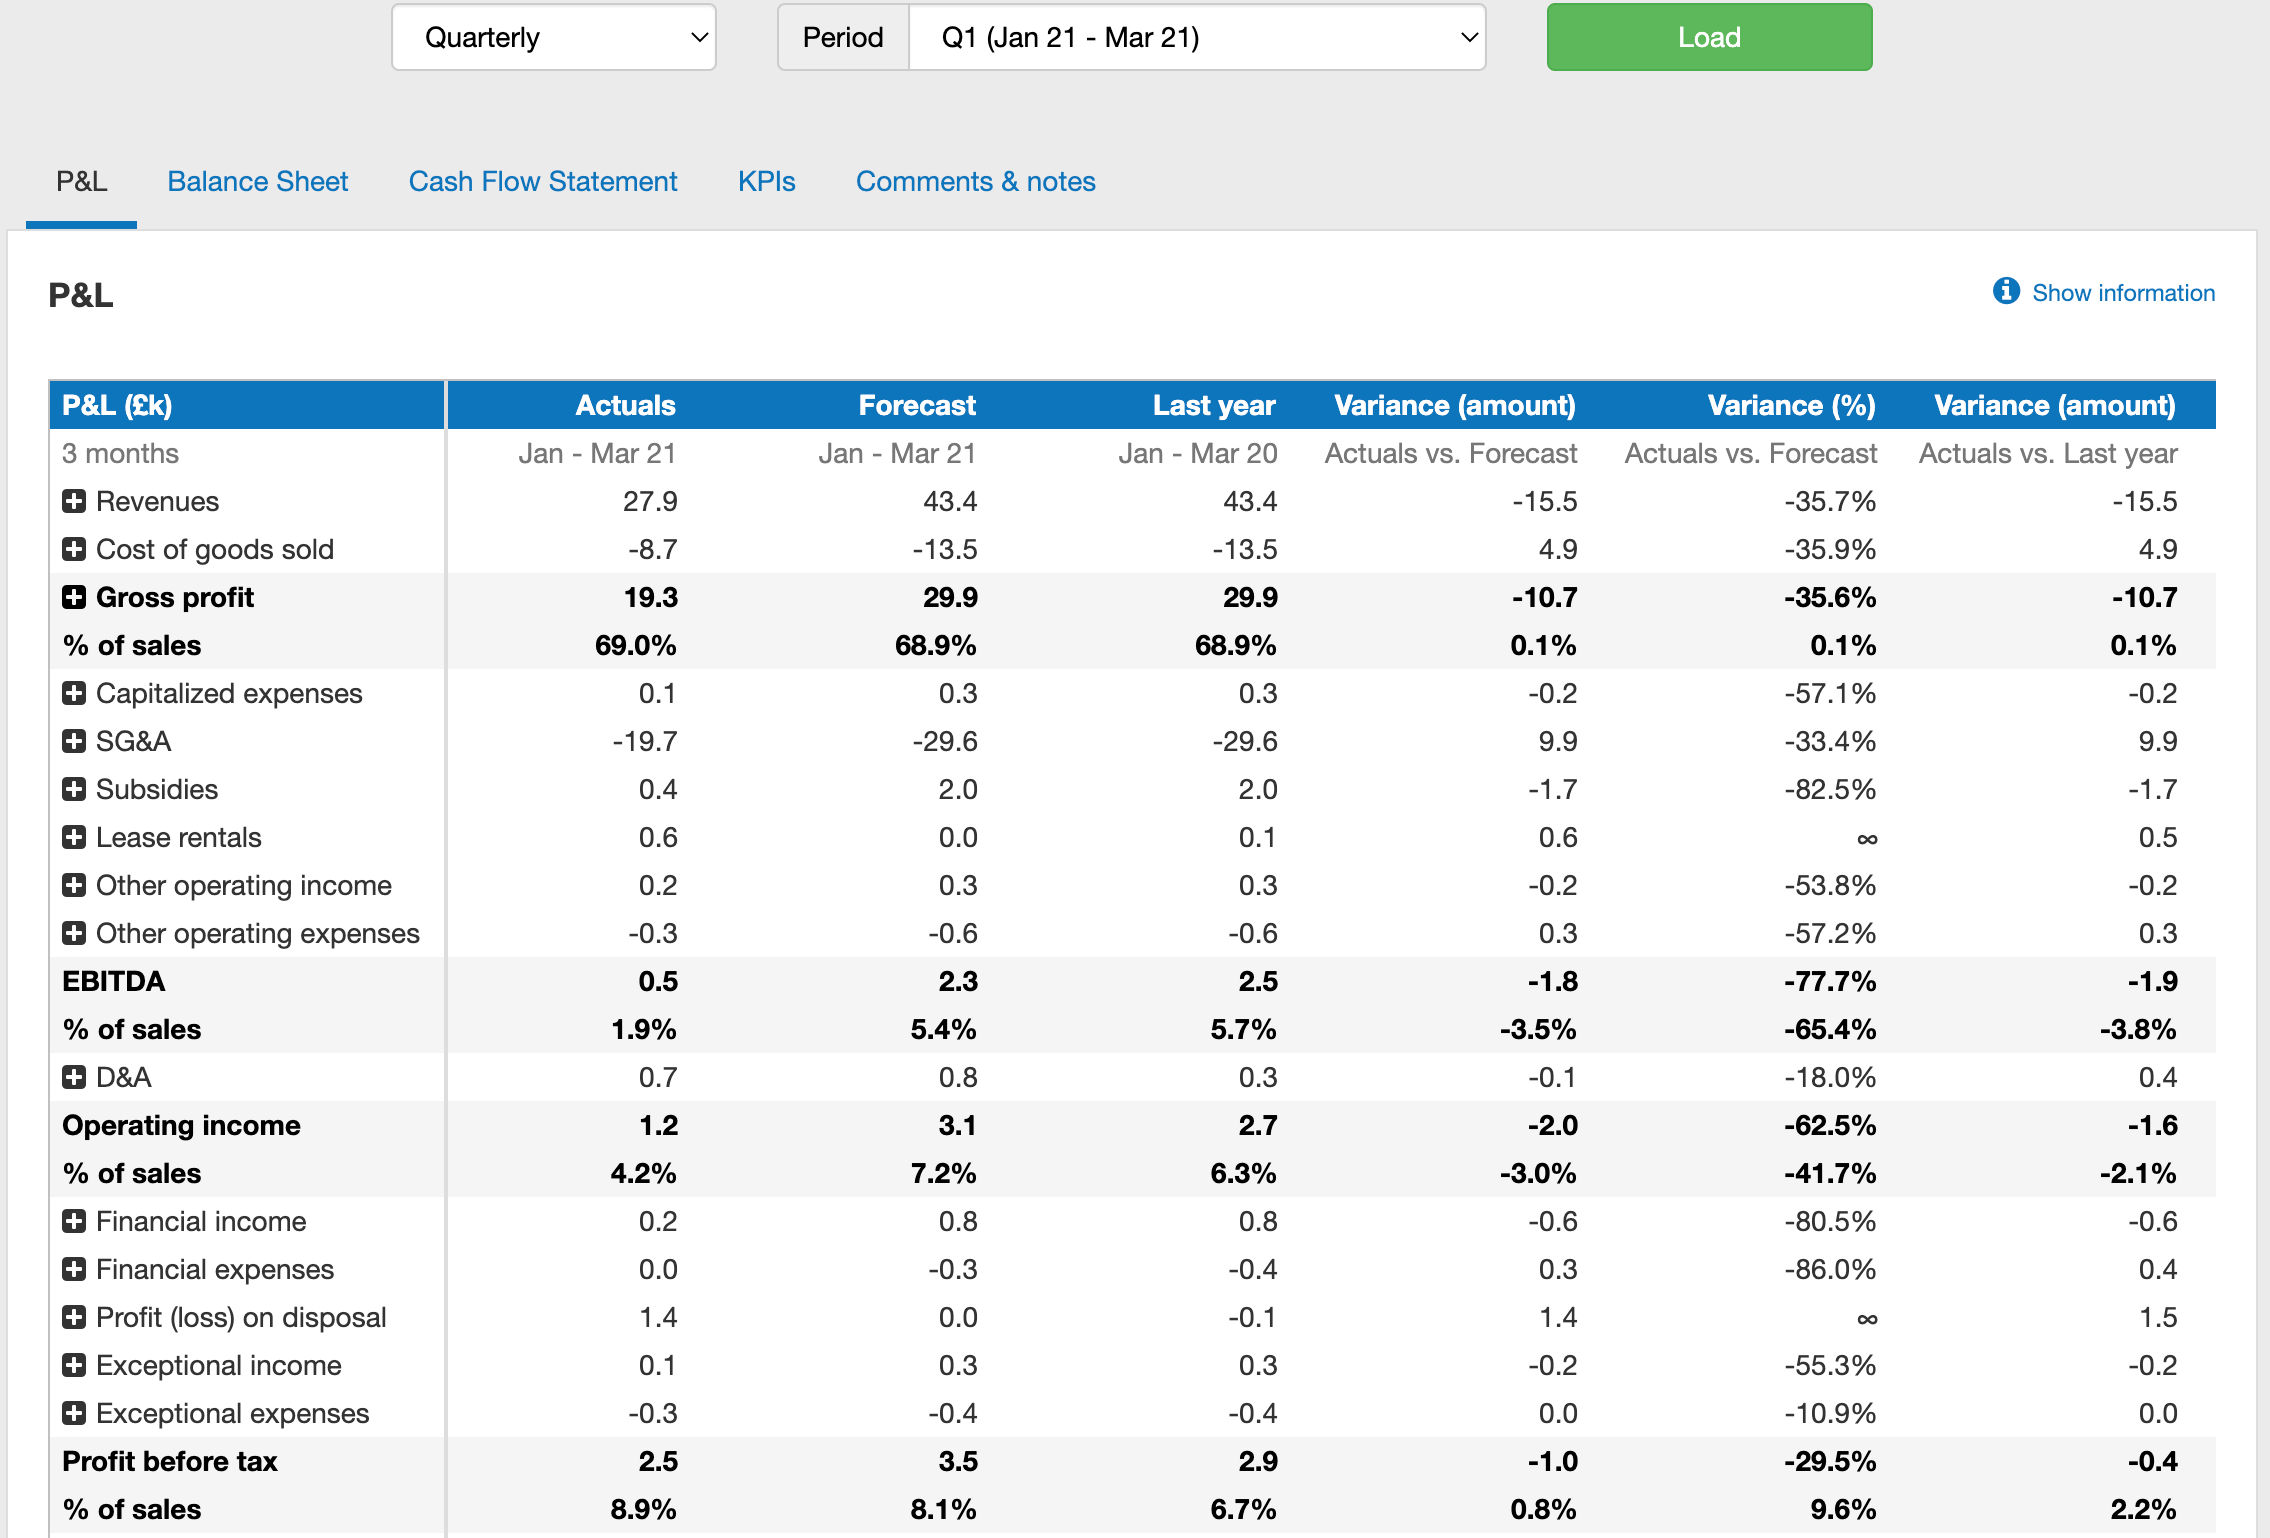
P&L tab
The P&L tab lets you compare your actuals to your forecasted performance for the chosen period. You can also compare your actuals to last year’s data.
This is achieved by calculating the variance between actuals and forecasted data for each of the lines in your P&L.
Balance Sheet tab
The balance sheet tab lets you compare your actuals to your forecasted performance for the chosen period. You can also compare your actuals to last year’s data.
This is achieved by calculating the variance between actuals and forecasted data for each of the lines in your balance sheet.
Cash flow statement tab
The cash flow statement tab lets you compare your actuals to your forecasted performance for the chosen period. You can also compare your actuals to last year’s data.
This is achieved by calculating the variance between actuals and forecasted data for each of the lines in your cash flow statement.
KPIs tab
The KPIs tab lets you compare your actuals to your forecasted performance for the chosen period. You can also compare your actuals to last year’s data.
This is achieved by looking at the value of your KPIs and whether or not they are on target.
Comments and notes tab
The comments & notes tab lets you write important notes on each page that may prove useful at a later point.
These notes can be kept private or shared with other users on your account.
Frequently Asked Questions
You'll be able to visualise how well your business performed compared to how you planned it was going to perform.
This can be used to adjust your forecast and make sure it remains up to date and accurate.
The actuals vs. forecast module lets you compare how you performed in the past financial year (or chosen period) against your forecast for that year (or chosen period).
The landing zone module combines the performance-to-date (YTD) and the forecast for the rest of the year to make a projection for the end of the current financial year.
You can access your last year's financial data by going onto the historical financial data module.
You can access your forecasted financial data for a specific period in the financial year or the entire financial year in the “financial forecast” module
The scenario analysis module allows you to compare the financial statements of different forecasts or scenarios (such as upside or downside cases), or company actuals vs forecasts. This is best used for what-if analysis.
The actuals vs. forecast module does not allow you to compare multiple forecasts side by side.
The actuals vs. forecast module uses the active forecast and corresponding company.
To view the analysis for another forecast, you can change the active business plan in the my projects module.
Go further with The Business Plan Shop
Was this page helpful?