How does the KPI editor work?
This article explains how you can use the KPI editor in The Business Plan Shop's financial forecasting software.
How does the KPI editor work?
Settings tab
The settings tab lets you build a custom KPI or select a ready-made KPI.
This can be done for either financial or non-financial data.
If you choose to build a custom KPI, you can also give it your own name and description.
In both cases you can set a specific target that you’d like that KPI to achieve.
Preview tab
The preview tab allows you to preview your KPI.
It shows you both actuals data and forecasted data which can be compared to the target that you’ve set for that particular KPI.
Comments and notes tab
The comments & notes tab lets you write notes on each page that may prove useful at a later stage.
These notes can be kept private or shared with other users that you have invited on your account.
Frequently Asked Questions
A system-defined KPI is a KPI that has a predefined formula which cannot be changed.
Our system-defined KPIs cover most of the common financial ratios used by financial analysts.
A custom KPI is a KPI that you can build yourself with our formula builder.
This is useful mainly for modelling non-financial data.
For example, you can build a KPI that tracks whether or not your lead conversion is on target for a given period.
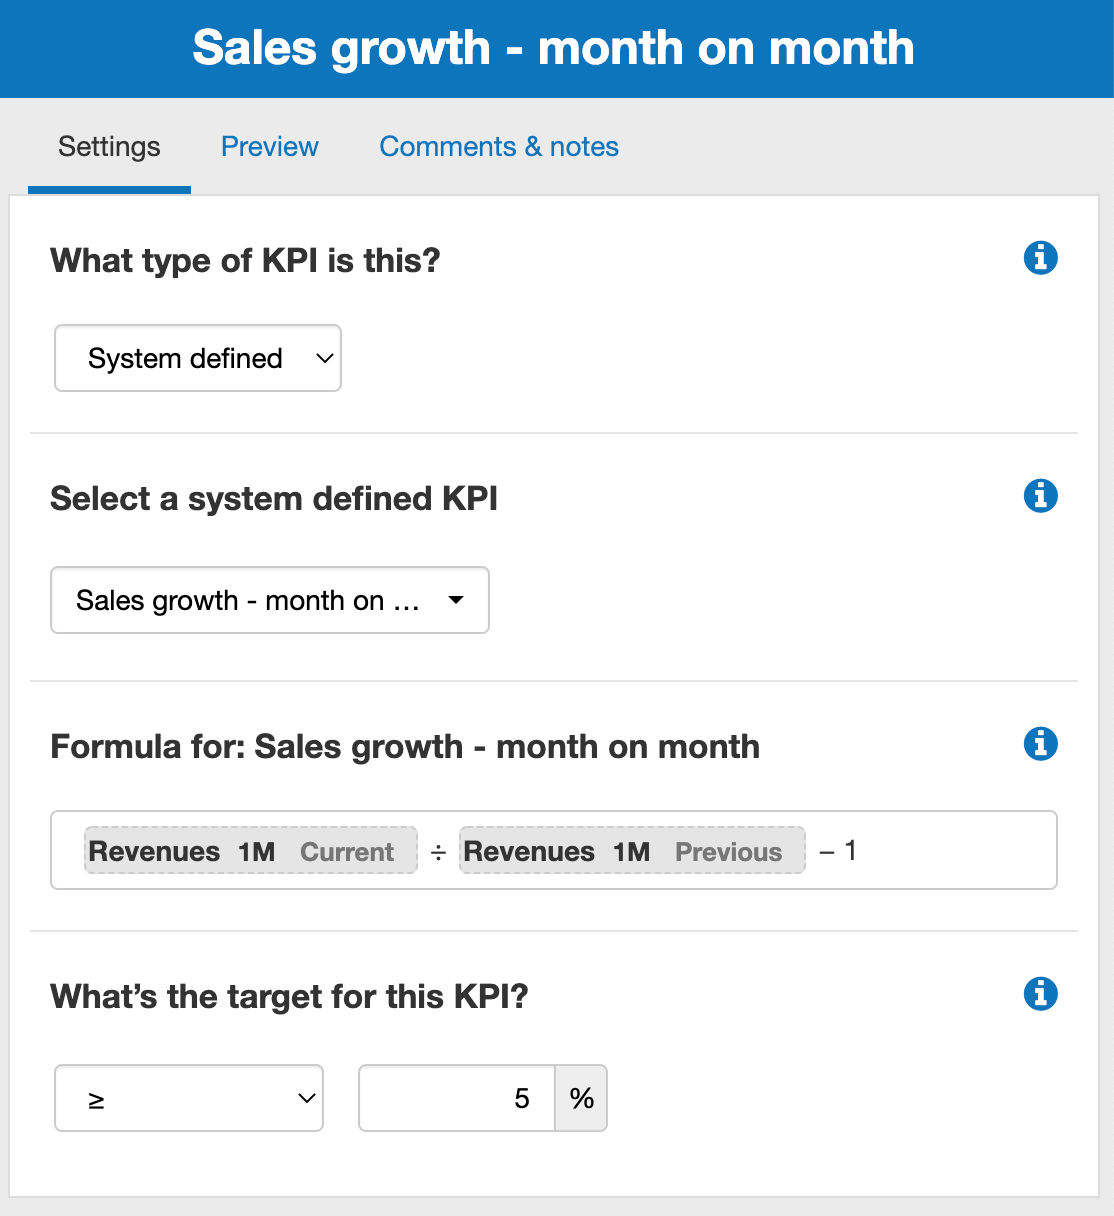
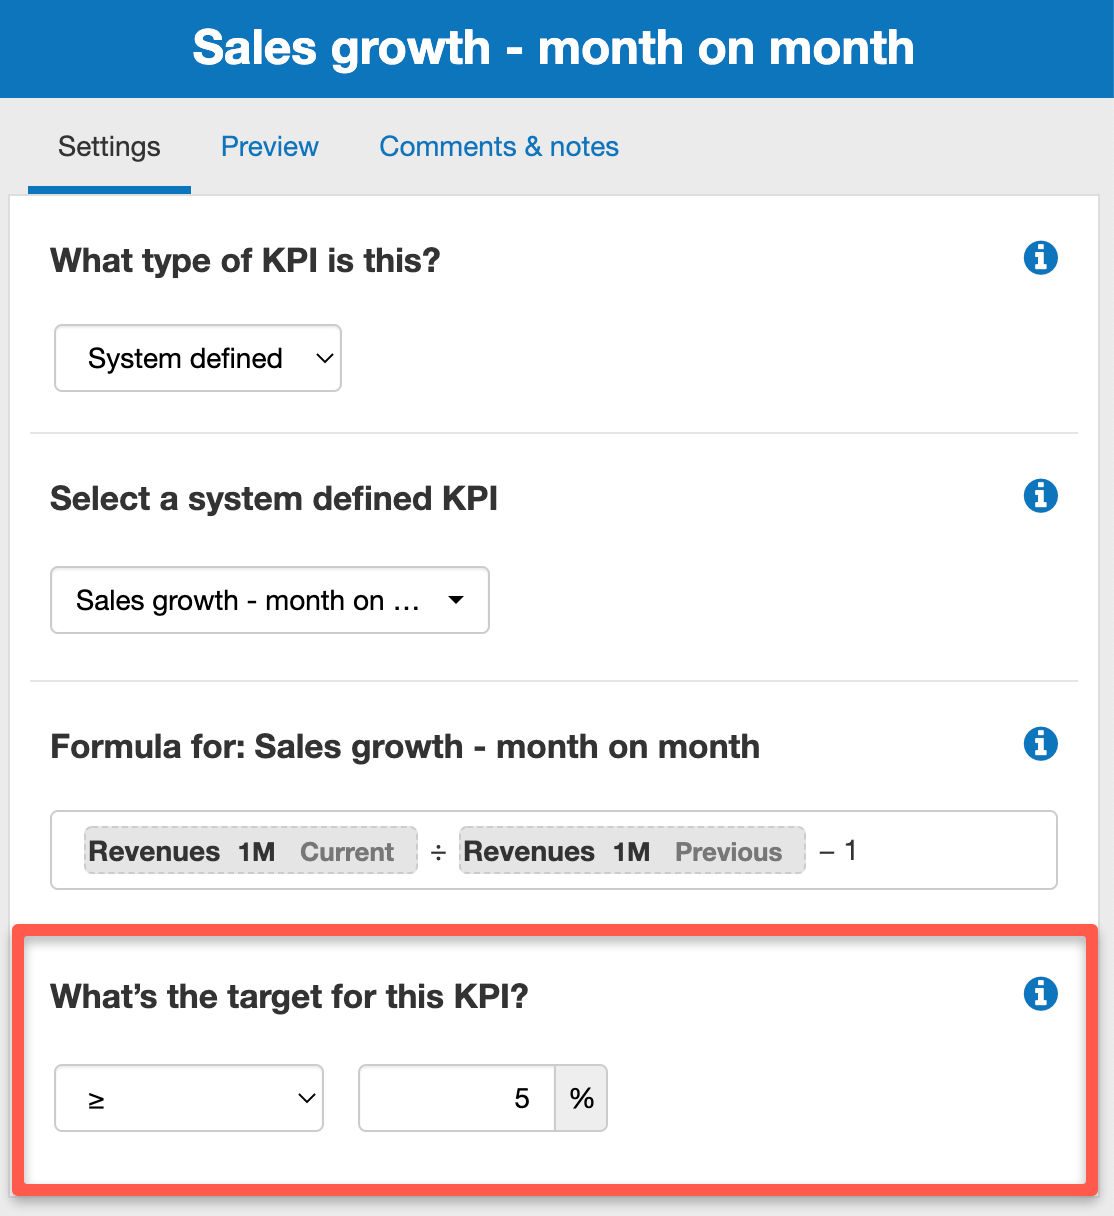
- Click on the settings tab at the top of the page
- Scroll down and you will see a heading named “What’s the target for this KPI?’
![setting a target for my KPI in The Business Plan Shop]()
- You can set a target equal to, greater than or less than
- Keep in mind that the target format (%, number etc) is correlated to the “What is the format of this KPI?” part of the module
- Click on the settings tab at the top of the page
- You’ll see a heading with the title “What is the name of this KPI?’
- Enter your chosen name in this text box
![changing the name of my KPI in The Business Plan Shop's financial forecasting software]()
- Enter your chosen name in this text box
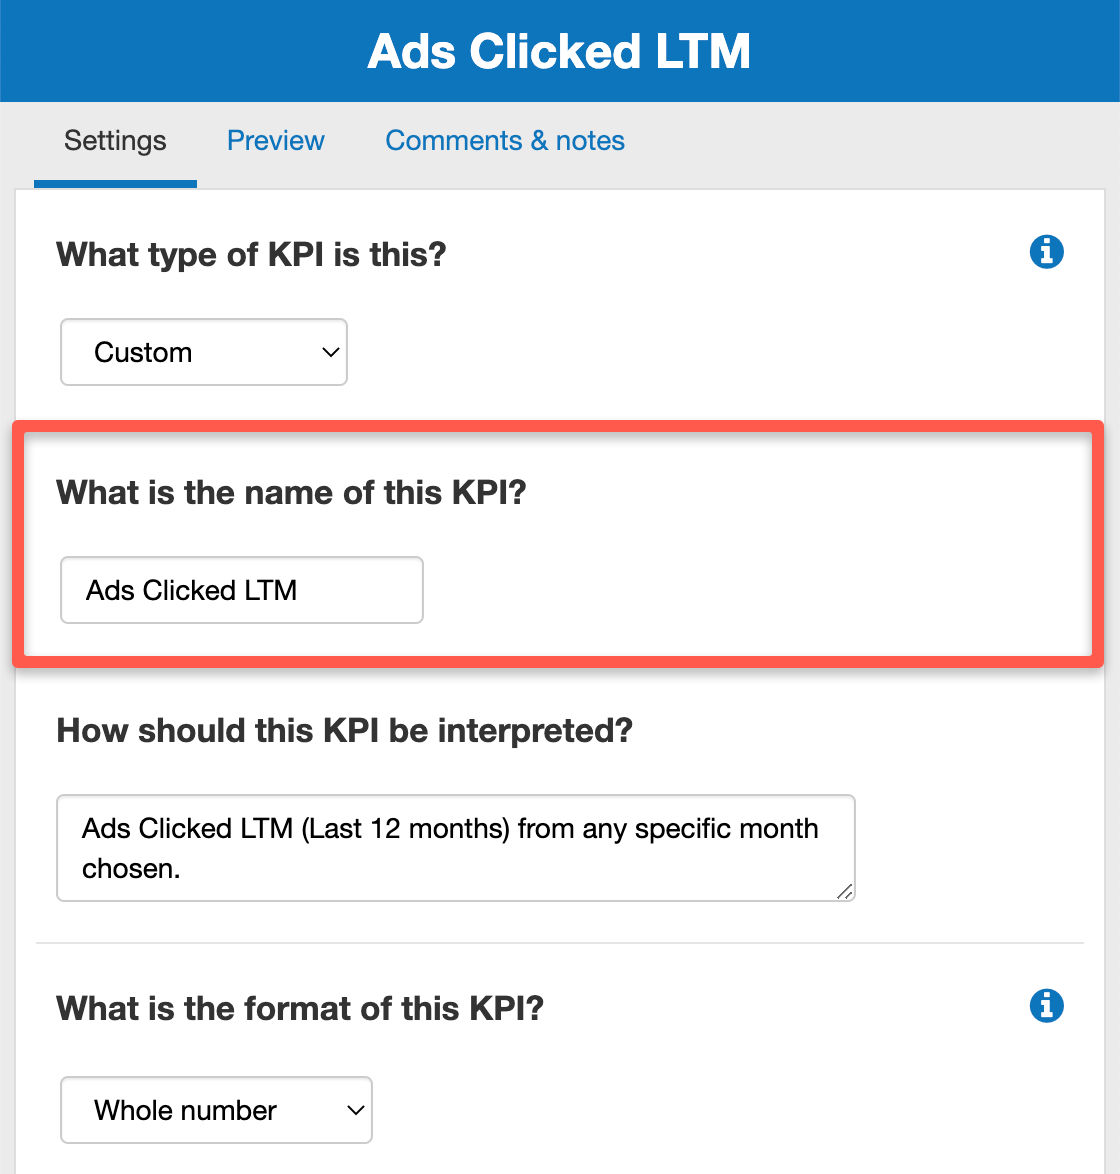
Note: You can only do this if you select a custom KPI.
- Click on the settings tab at the top of the page
- You’ll see a heading with the title 'How should this KPI be interpreted?’
![changing my KPI description in The Business Plan Shop's online software]()
- Enter your chosen description in this text box
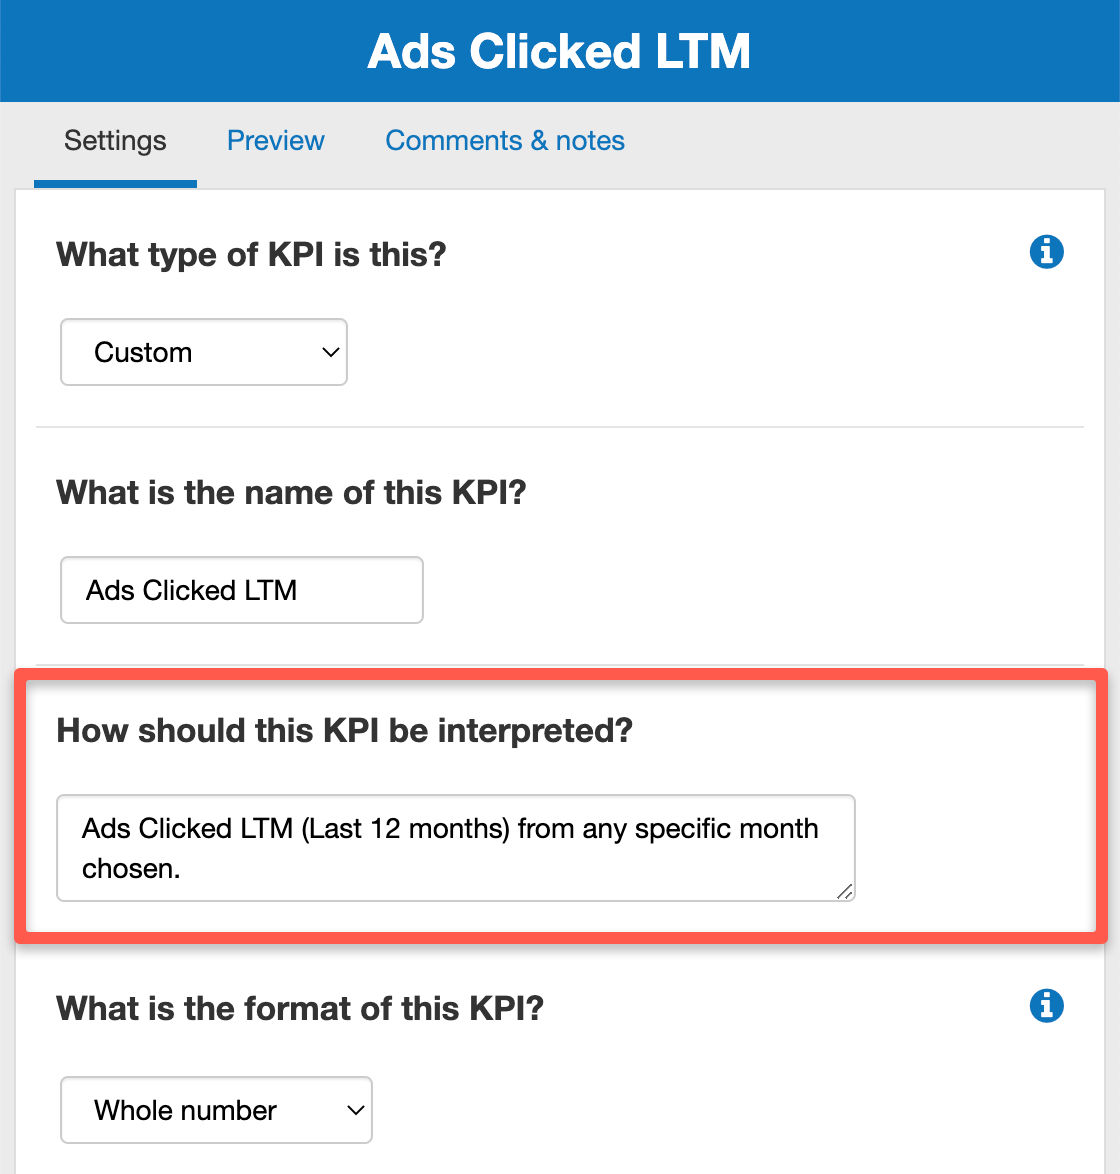
Note: You can only do this if you select a custom KPI.
- Click on the settings tab at the top of the page
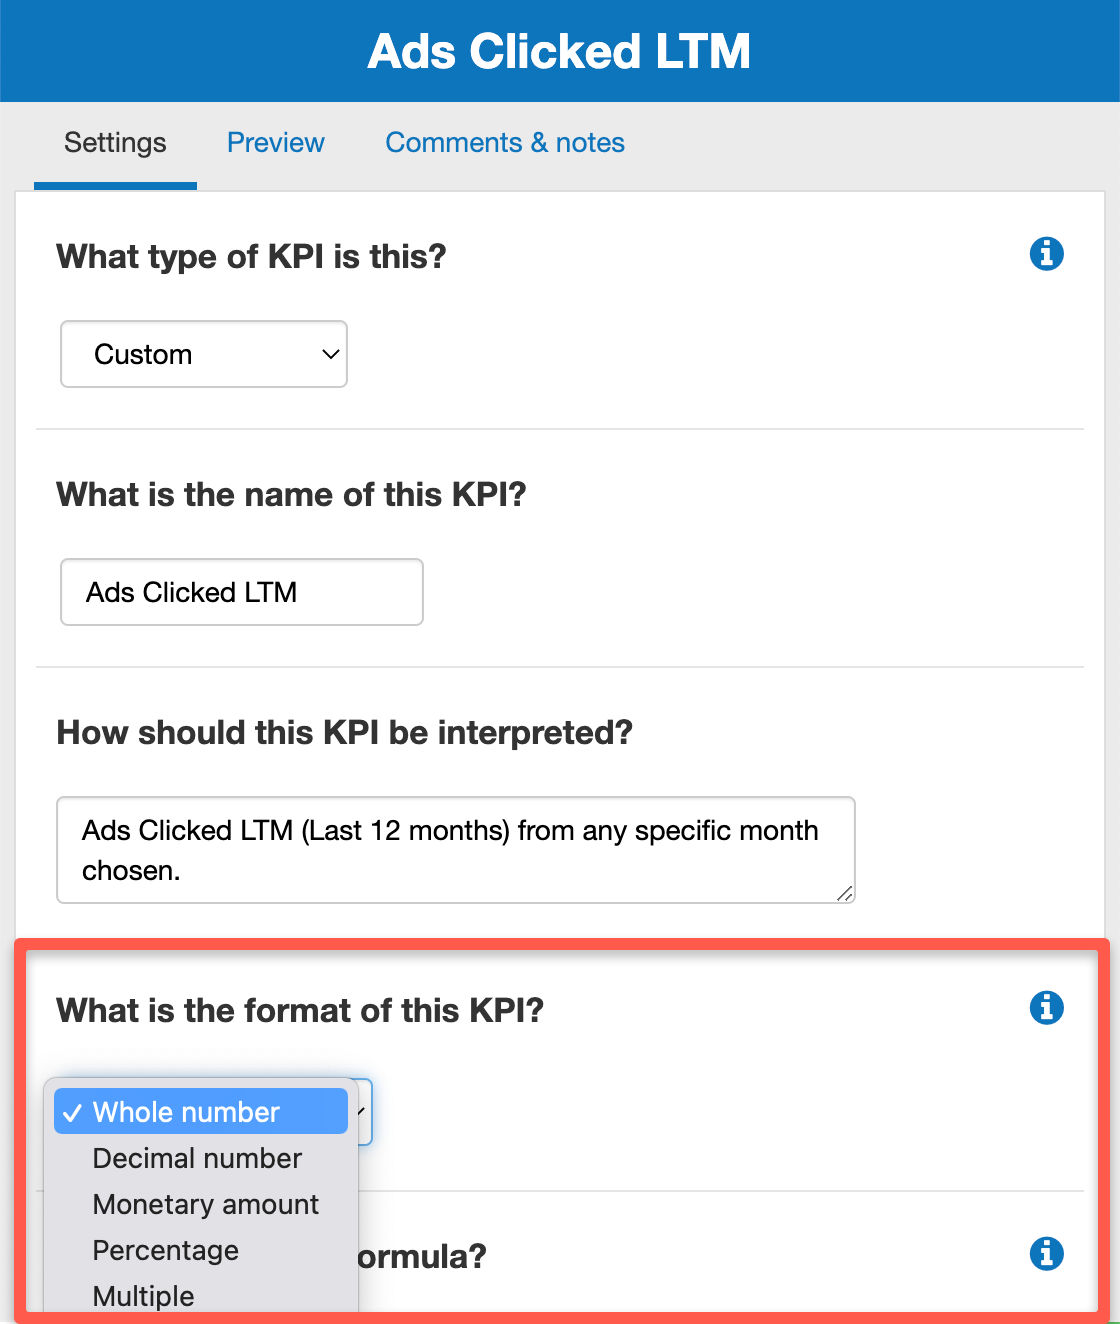
- You’ll see a heading with the title “What is the format of this KPI?”
![deciding what numerical format I want my KPI to take in The Business Plan Shop]()
- You can choose from one of the following five formats depending on your dataset
- Whole number, Decimal number, Monetary amount, Percentage or Multiple
- There are four formats you can choose for a KPI:
- Whole number, Decimal number, Monetary amount, Percentage or Multiple
- The format you pick depends on the nature of your data
- For example if you’re computing a margin, it should be percentage
- Similarly, if you’re looking at the number of leads per month, it’s probably better to select whole number
- Click on the settings tab at the top of the page
- Scroll down to the heading named "What is this KPI's formula?"
![Using The Business Plan Shop's formula builder to create custom KPI]()
- If this is a new KPI, a pre-selected formula will already be present based on the system-defined KPI
- Delete this formula using the backspace button
- If you don't know how to delete part of the formula, check out our FAQ below
- You can now build your own formula
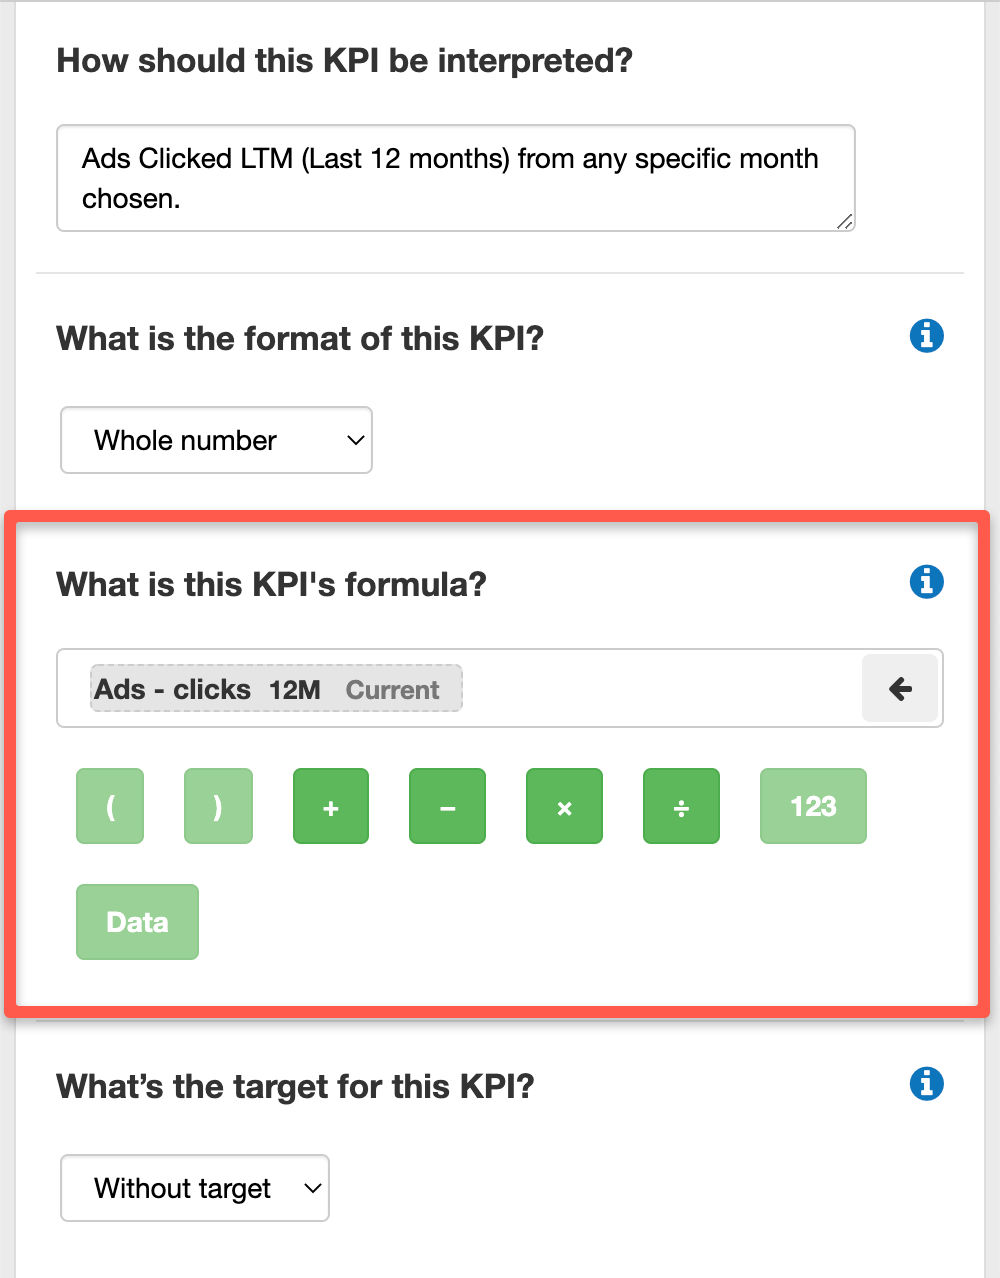
What each of the buttons in the formula builder do: (referring to the image above)
- The brackets are useful if the formula is complex
- The + and - buttons are simply add and subtract buttons
- The ÷ and x buttons are simply divide and multiply buttons
- You can use the 123 button to add a constant to your formula (a number)
- The "data" button lets you add a metric to your custom KPI (read more about this below the image)
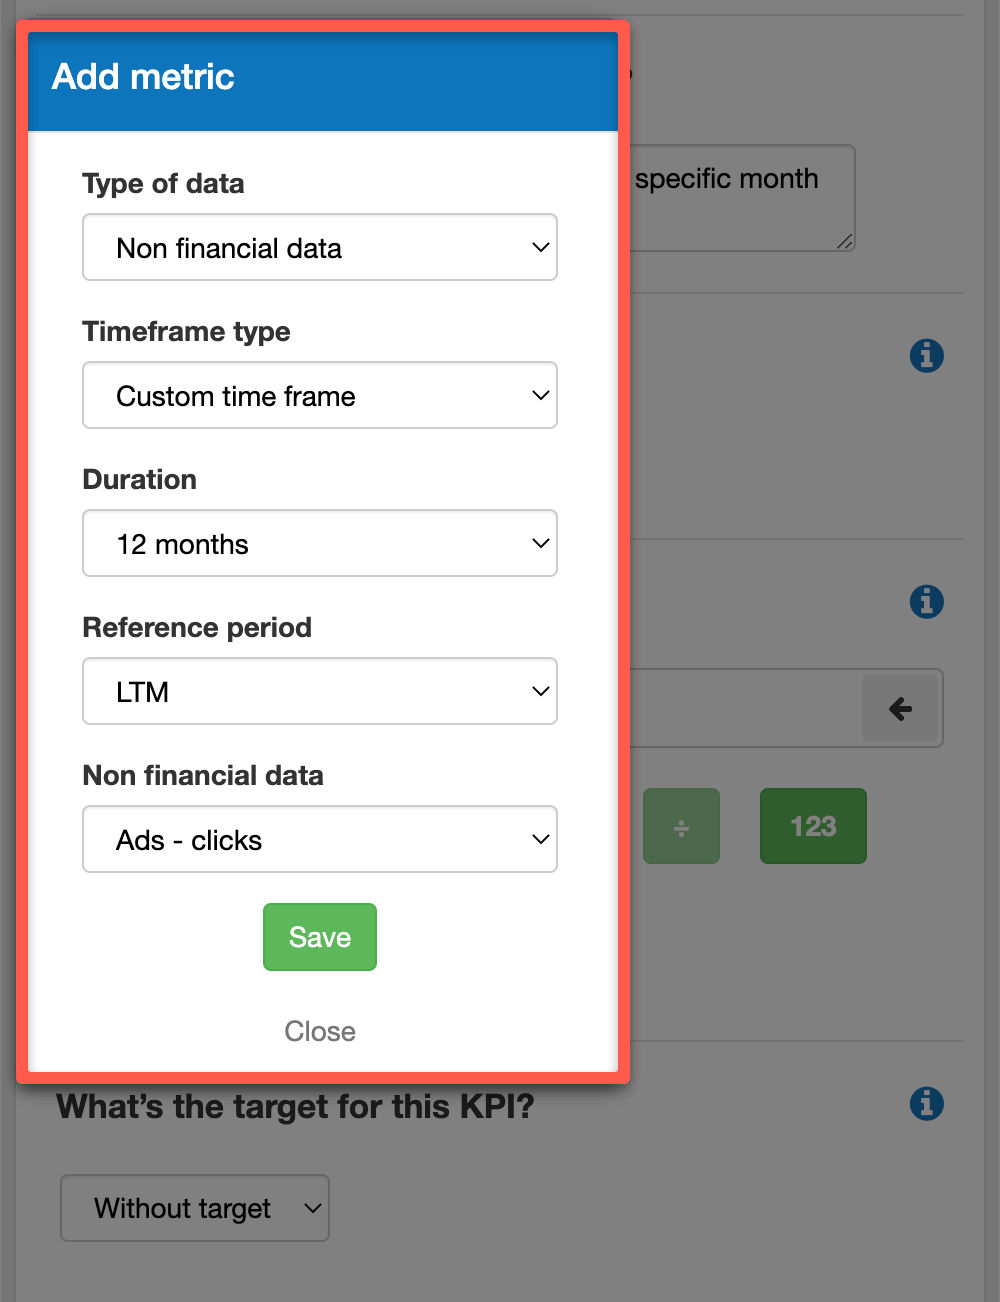
How the add metric function works (non-financial data):
- You'll need to keep in mind the non-financial data metric that you want to build your KPI on
- For example, this could be ads clicked or staff departures
- You can either choose a custom time frame or year-to-date (YTD)
- If you choose custom time frame, then you'll have to decide on the duration and reference period
- If you choose year-to-date (YTD), then the duration is already decided by definition of YTD, so you'll only need to pick the reference period
- For example, my KPI could be ads clicked during the last 12 months (LTM) or staff departures using the current year-to-date.
How the add metric function works (financial data):
- You'll need to keep in mind the financial data metric that you want to build your KPI on
- For example, this could be revenues or gross profit
- You can either choose a custom time frame or year-to-date (YTD)
- If you choose custom time frame, then you'll have to decide on the duration and reference period
- If you choose year-to-date (YTD), than the duration is already decided by definition of YTD, so you'll only need to pick the reference period
- For example, my KPI could be revenues during the last 12 months (LTM) or gross profit using the current year-to-date
- If you've entered a segment in your financial forecast, you can use this to filter
- For example, I could filter specific revenue streams if I use segments in the business lines module
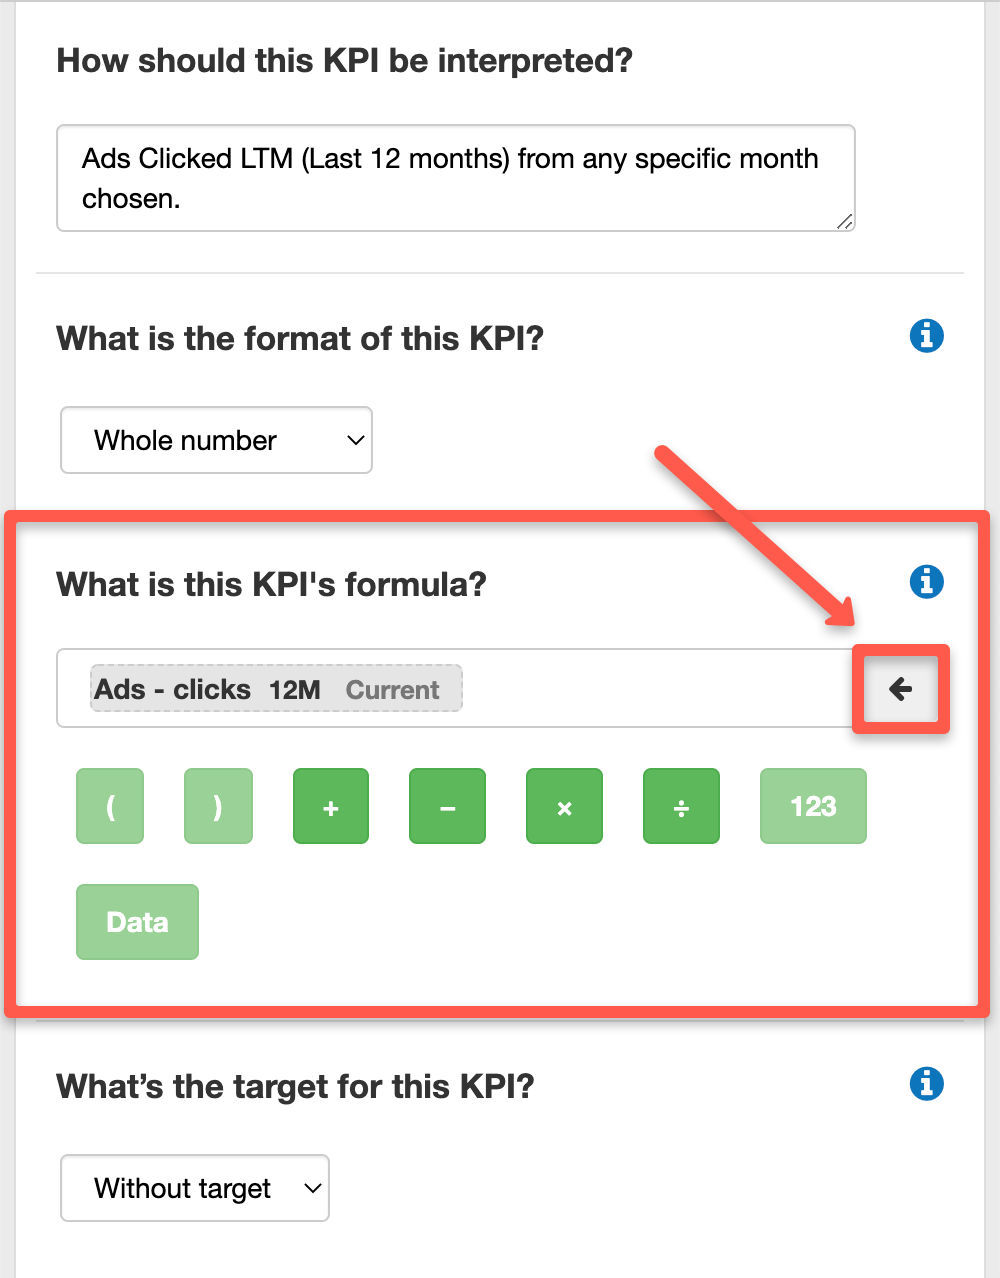
Click on the backspace arrow inside the KPI formula builder
If you’re KPI is on track, it either meets or exceeds the target that you’ve set for it during that period
If you’re KPI is not on track, it will be lower than the target that you’ve set for it during that period
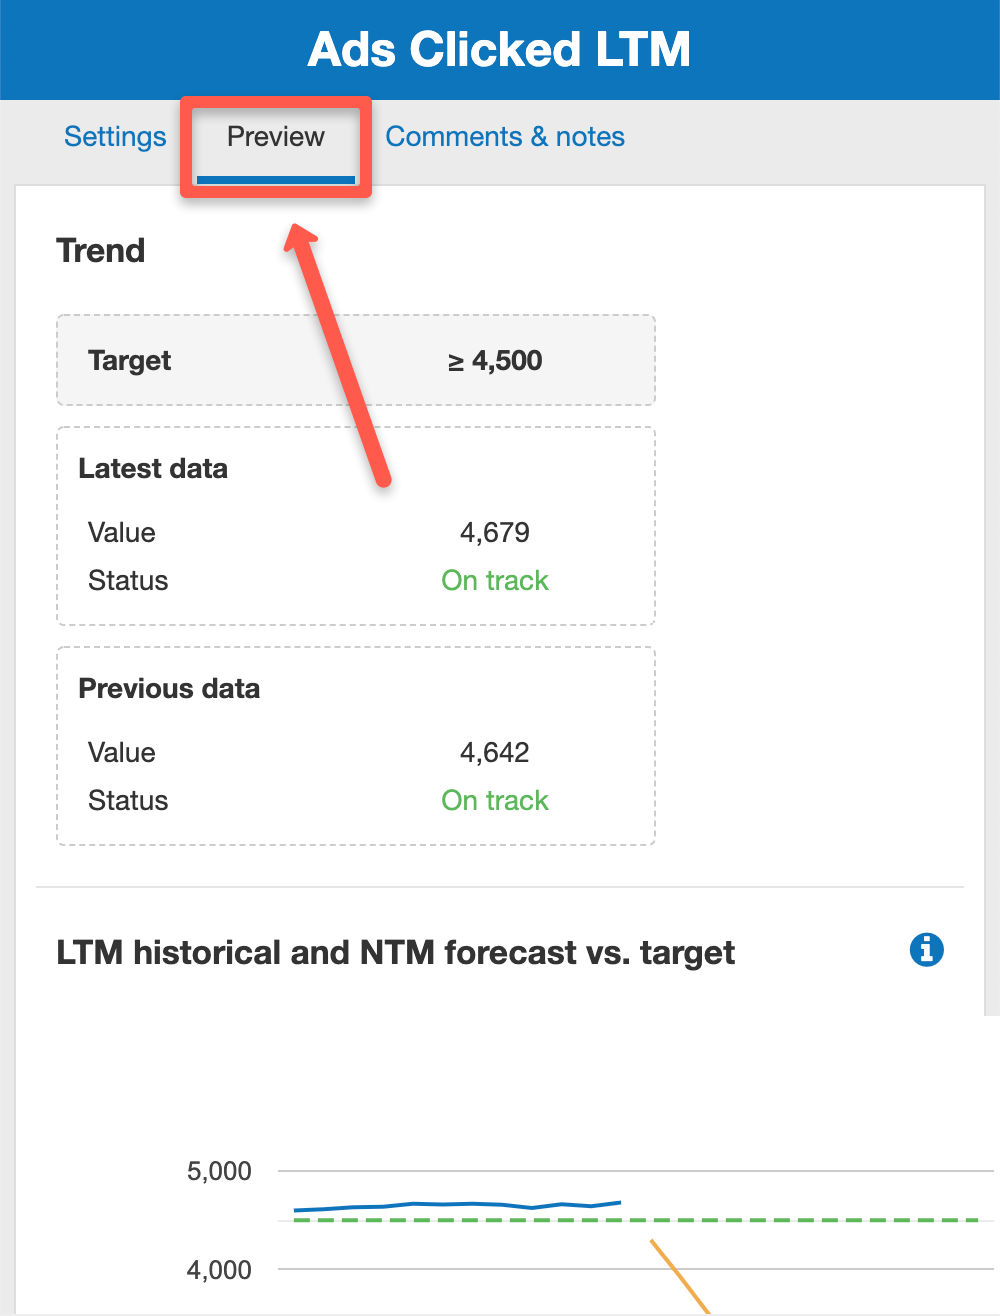
- Click on the preview tab at the top of the page
![clicking on the preview tab to visualise my KPIs quickly in chart form]()
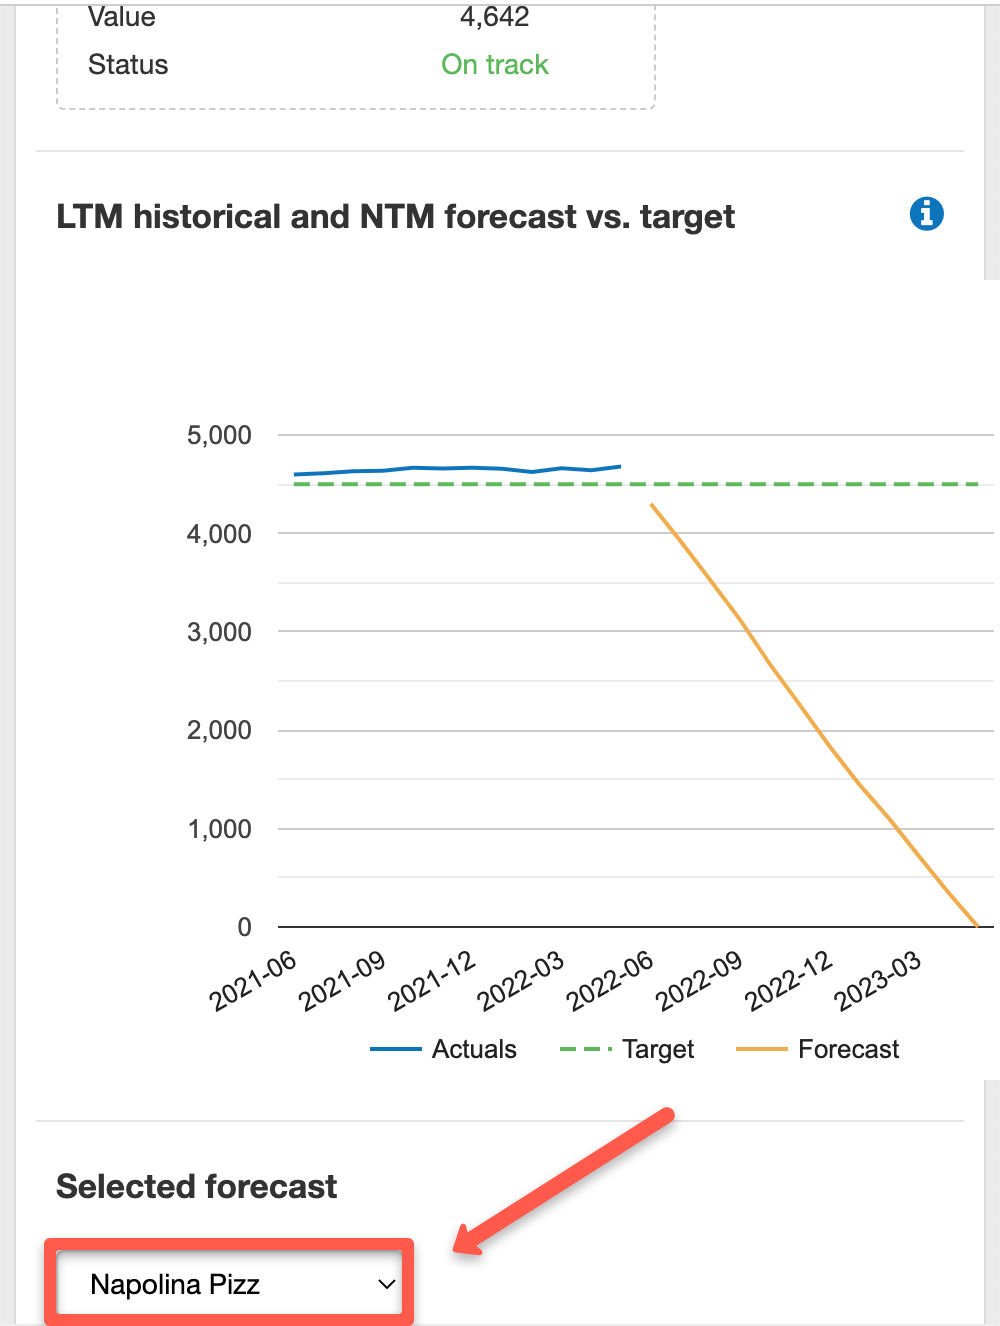
- Scroll down below the graph and you'll see a heading named "selected forecast"
- You can now choose which forecast you want by selecting from the dropdown menu
![choosing the financial forecast and related data that I want to use for my KPI in The Business Plan Shop]()
- The graph and it's related data will change based on the forecast you pick
- You can now choose which forecast you want by selecting from the dropdown menu
Go further with The Business Plan Shop
Was this page helpful?