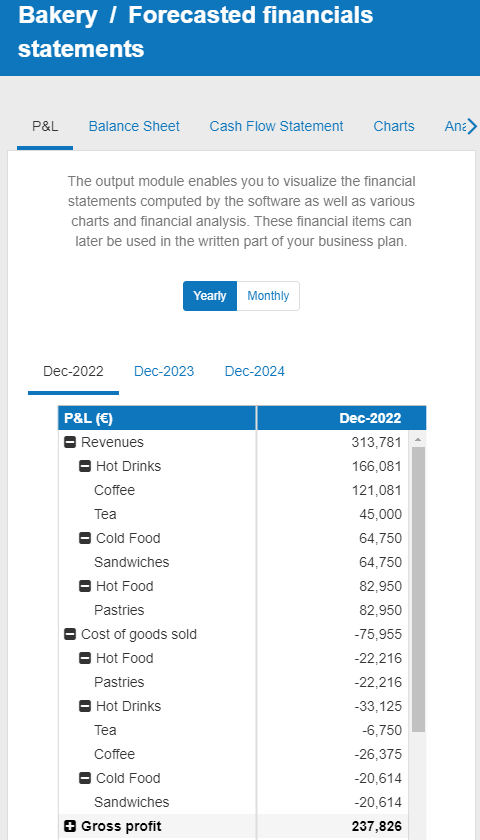
How can I enter business lines data?
This article explains how to enter business lines in The Business Plan Shop’s financial forecasting software.
This data enables our software to build your forecasted financial statements (balance sheet, P&L, cash flow statement), which can then be downloaded along with your business plan.
It’s fast and easy to do.
How can I add or edit business lines in The Business Plan Shop?
Firstly, follow this link to access the business lines module
Once you are on the module, you can either click the add button at the top of the list to add a new business line or edit an existing one.
If you are on desktop, to edit an existing business line:
- Hover your mouse over the row containing the business line in the list
- Click the edit button that appears
If you are on mobile, to edit an existing business line:
- Click on the settings icon at the end of the row containing the business line in the list
- Click on the edit button that appears
How does the edit business lines module work?
The module contains tabs that enable you to enter the financial data required to model your revenues, cost of goods sold, and inventory.
Parameters tab
The parameters tab allows you to enter the name of your business line.
This tab also contains an advanced options panel where you can associate the business line to a segment or enter deferred revenues/costs. See the FAQ below for more information on these advanced features.
Revenues tab
The revenues tab allows you to build your sales forecast. You can choose to compute the sales figure using price multiplied by volume sold, or to enter the amount directly into the software.
Note that you can enter the amount monthly or annually. If you enter an annual amount, the software will allocate one-twelfth of the revenue to each month.
Production costs and purchases tab
The production costs and purchases tab allows you forecast your production (or procurement) costs for that specific business line.
You can forecast your production costs using either the cost per unit or % of sales method. Alternatively, you could input the value directly into the software.
Note that you can enter the amount monthly or annually. If you enter an annual amount, the software will allocate one-twelfth of the cost to each month.
Inventory tab
The inventory tab allows you to manage your inventory manually for that specific business line.
You can either enter the quanity of items produced/purchased, or input the inventory value directly into the software.
Payment terms tab
The payment terms tab allows you to enter the payment terms that you have agreed with your suppliers and clients (cash, credit or payment in advance).
Note that the percentage must total 100 for each financial year that data is entered for, or the software will allocate the remaining percentage automatically.
VAT/GST tab
The sales tax / GST tab allows you to change details related to your VAT, GST, or equivalent sales taxes. You can choose the tax rate and the date from which the tax is owed (either when receiving the invoice or making the payment).
Note that this tab is hidden for users that are not registered to pay VAT or equivalent sales taxes. The name of the tab also varies based on the locale (English US or GB) of the application.
Comments & tab
The comments & notes tab lets you write important notes on each page that may prove useful at a later point.
These notes can be kept private or shared with other users that you have invited on your account.
How does the edit business lines module impact my financial forecast?
The Business Plan Shop’s software will use your business lines data to create your forecasted financial statements (P&L, balance sheet and cash flow statement).
These statements also form part of the financial plan section of your business plan.
As soon as you save a new business lines amount, the software will automatically recalculate everything to ensure that your financial forecast is up to date. It’s fast and simple, meaning that your plan will always be ready to export.
When building your forecasted financial statements:
- We’ll use the amount entered to build the sales and cost of goods sold sections in your P&L.
- We will then use your inventory, payment terms and optional VAT/GST settings to build your balance sheet (inventory, amount owed by clients or to suppliers, and tax owed to the government)
- We’ll then combine all this data to build your cash flow forecast.
- If part of your sales or costs need to be deferred to the next accounting period, you can use the optional deferred revenues and deferred cost module. In that case, we’ll also adjust the amount recognized on your P&L and balance sheet accordingly.
What advice can you give me to get started with the business lines module?
Do a thorough market analysis first - find out details about competitors, customers and suppliers.
- How much are suppliers likely to charge for raw materials? Ask them to provide cost estimates.
- Are you operating in a competitive industry? If so, is it a good idea to charge prices that are slightly below that of competitors?
- Is there a gap in the market? If so, what goods or services are customers looking for specifically?
We suggest that you limit the number of business lines to 5. This simplifies the model and means that the number of assumptions remain manageable.
- For example, it would be impractical for restaurant owners to use a separate business line for each dish.
- Instead, they could classify business lines according to the following criteria: starters, main meals, desserts, alcoholic beverages and non-alcoholic beverages.
- Revenues achieved from any soft drinks would consequently be entered into the “non-alcoholic beverage” business line. Similarly, any revenue obtained from fish and chip sales would be entered into the “main meals” business line.
Frequently Asked Questions
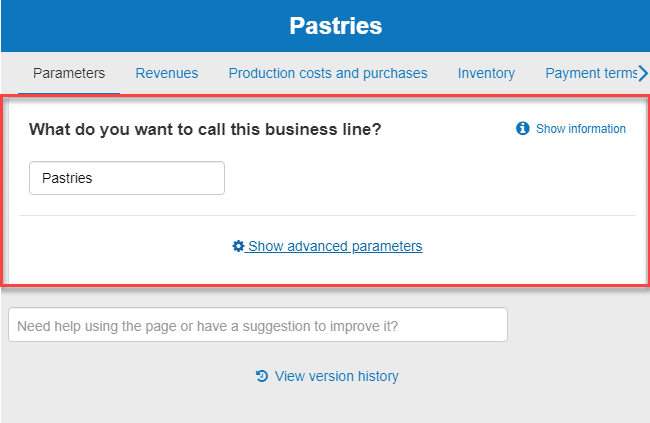
- Firstly, click on the settings tab at the top of this page
- Next, you’ll see a text box with the heading “What do you want to call this business line?"
![entering pastries as my business line in the business plan shop's financial forecasting software]()
- Enter your chosen name into the text box given (In this example, we’ve chosen pastries as the business line).
- Finally, press the “save and close” button.
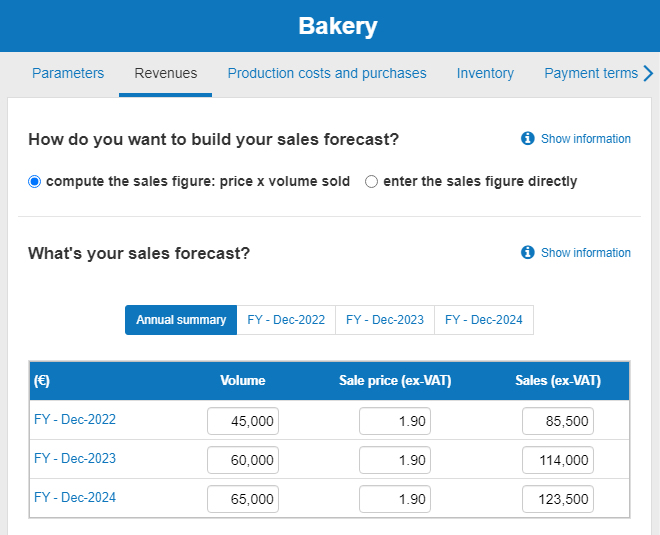
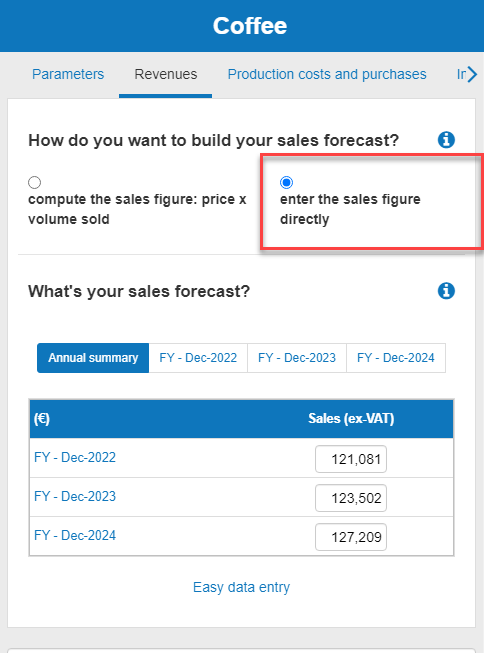
- Firstly, click on the revenues tab at the top of this page
- Next, you’ll see a text box with the heading “How do you want to build your sales forecast?"
- You'll now be given a choice of two ways to build your forecast. You can either:
- Compute the sales figure: price x volume sold
![using price multipled by volume sold to build my sales forecast]()
- Enter the sales figure directly
![entering the sales figure directly to build my sales forecast]()
- Compute the sales figure: price x volume sold
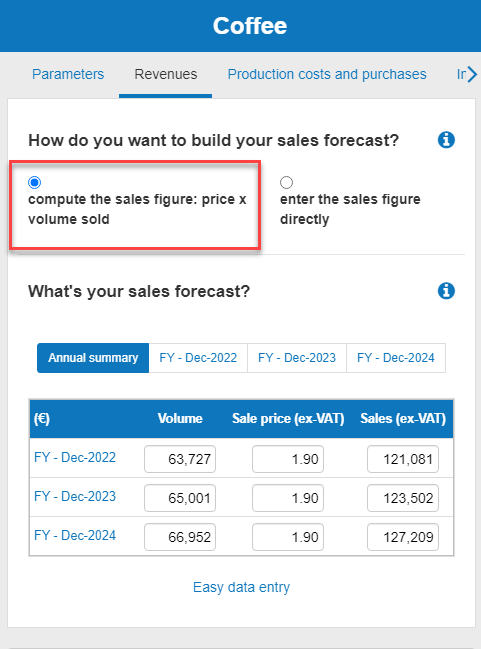
Two methods to build your sales forecast
Choose price x volume sold if you want to compute the sales using a volume and price hypothesis.
Depending on the nature of your business:
- Price can be: the average price per unit, the average contract value, a price per hour, etc.
- Volume can be: the number of units sold, number of contracts sold, number of hours billed, etc.
Computing the sales is useful if you want test different price or volume hypothesis in your business plan.
Notes:
If you choose to enter the sales figure directly, you cannot choose the "cost per unit" option when entering production costs in the "production costs and purchases tab."
Similarly, if you choose to enter the sales figure directly, you cannot choose the "enter the quantity of items produced/purchased" in the inventory tab.
- Firstly, click on the production costs and purchases tab at the top of this page
- Next, you’ll see a text box with the heading “Does this business line have a production (or procurement) cost?"
- Select yes
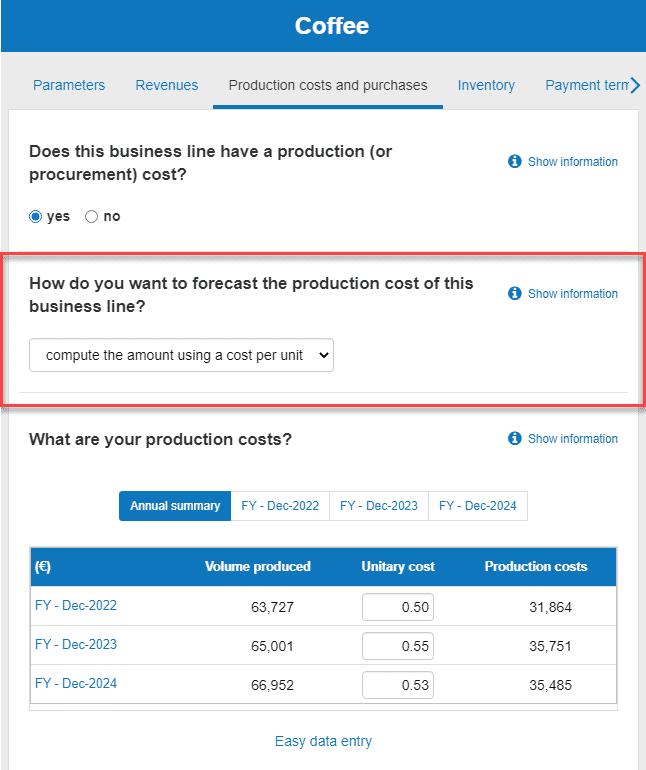
- You'll now be given a choice of three ways to input your data. You can either:
- Compute the amount using a cost per unit
![computing the production costs using cost per unit]()
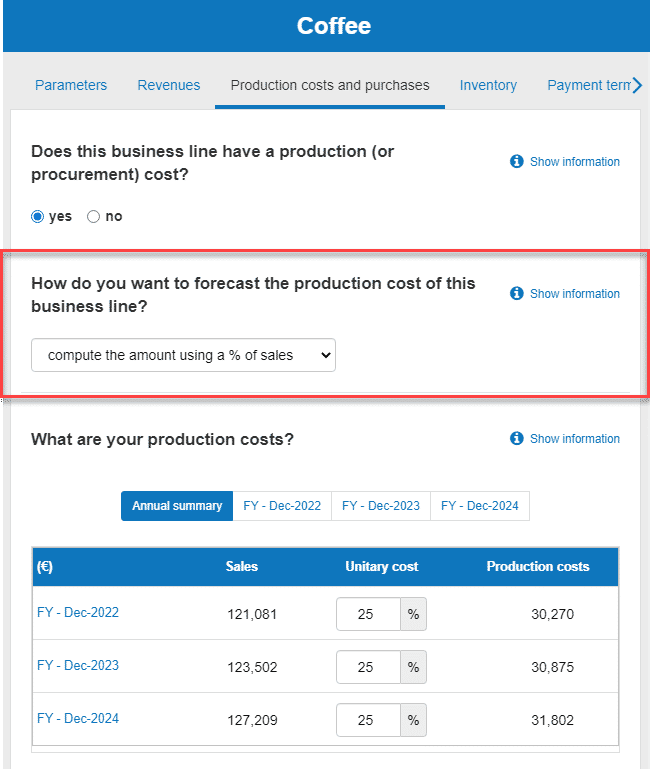
- Compute the amount using a % of sales
![computing the production costs using a % of sales]()
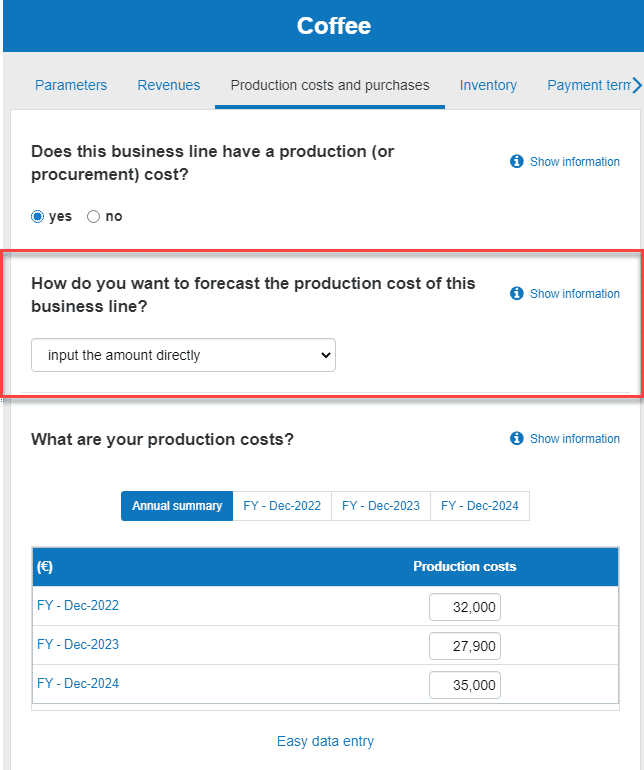
- Input the amount directly
![computing the production costs by inputting the amount directly]()
- Compute the amount using a cost per unit
Is this tab useful for my business?
It's useful if there are direct cost of sales related to this business line, such as raw materials, or purchases of goods if you are a retailer.
The production cost will be used by the software to compute the cost of goods sold (COGS) and to value your inventories (if applicable).
If you are selling services you may not have any production costs, in that case you probably won't need to enter anything.
The three methods of forecasting production costs:
- Compute the amount using a cost per unit:
When using a cost per unit, the value of the production costs is computed by doing: cost per unit x volume of items produced.
It is a good choice when the cost per unit and volume are Key Performance Indicators in your business. For example if you are a producer whith a fixed production capacity, or a retailer who needs to keep track of the quantity of goods ordered.
This option can only be used if the sales are forecast using the price x volume sold method. If you want to use inventories with the method, you will have to forecast their value using the volume of items in the inventory.
- Compute the amount using a % of sales:
When using a percentage of sales, the value of the production costs is computed by doing: sales x % of sales.
This is the easiest method as the value of your production costs will update automatically when you change your sales forecast.
- Input the amount directly:
This is useful if you already assessed your production costs or total purchases separately.
Notes
If you chose to enter your sales figure directly in the revenues tab, you cannot choose the "cost per unit" option.
If you choose compute your production costs using the cost per unit method, you cannot choose the "enter the value directly" in the inventory tab.
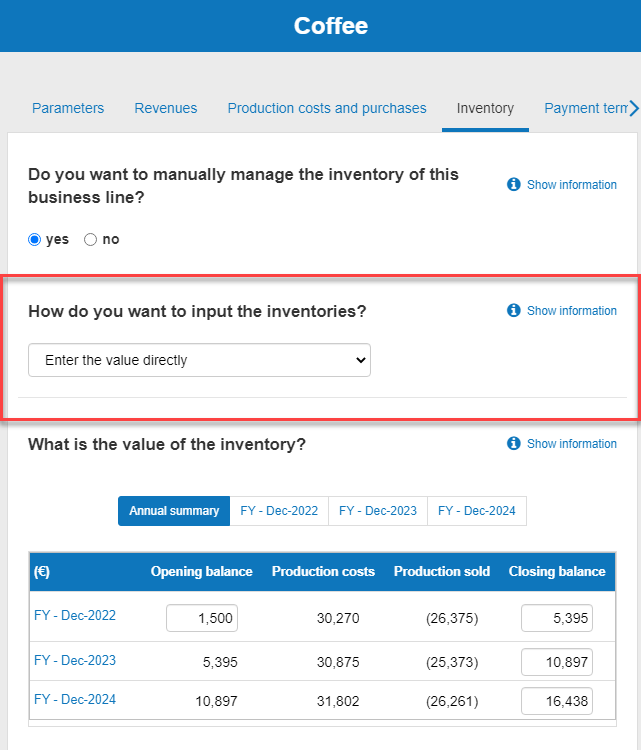
- Firstly, click on the Inventory tab at the top of this page
- Next, you’ll see a text box with the heading “Do you want to manually manage the inventory of this business line?"
- Select yes
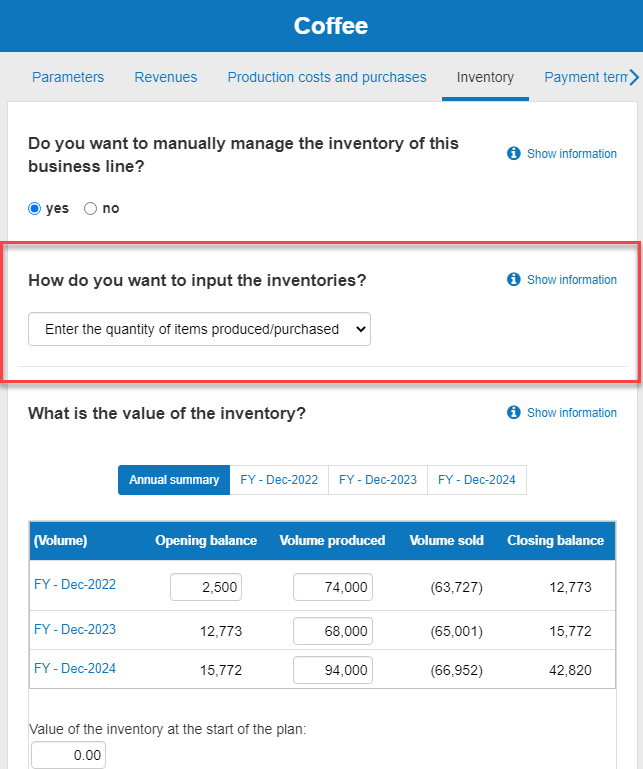
- You'll now be given a choice of two ways to input your inventories. You can either:
- Enter the quantity of items produced/purchased
![entering the quantity of items produced/purchased to model inventory]()
- Enter the value directly
![entering the value directly to model inventory]()
- Enter the quantity of items produced/purchased
The two methods of inputting your inventories:
- Enter the quantity of items produced/purchased
This option enables you to enter the quantity of items in inventory. The software then uses this data to compute the value of your inventory and the cost of goods sold using the data inputted in the previous sections and the weighted average cost method.
This option is the only one available if you choose to use a cost per unit in the production costs section.
- Enter the value directly
This option enables you to enter the inventory value at the end of each period.
Our software then uses this data, and the data entered in the cost section, to compute the Cost of Goods Sold (COGS) for each period.
This option is good when you already know precisely what the value of your inventory should be at the end of each period.
Notes:
If you chose to use the cost per unit method to calculate production costs in the "production costs and purchases" tab, you cannot enter the value of your inventories directly.
You can enter either annual or monthly data into the tables.
How can I enter annual data?
You can enter annual data by clicking on annual summary - you will a input field for each of the financial years (FY) in your forecast.
You can also enter annual data by filling the “total for the year” field in the monthly view of each financial year.
Use the navigation at the top of the table to toggle between the annual summary and the monthly view of each financial year.
Press the “save and close” button when you are done
How can I enter monthly data?
Use the navigation at the top of the table to select the monthly view of the financial year for which you wish to enter data.

Then enter the amount for each month and press the “save and close” button when you are done:
Notes:
Mensualisation
By default when you enter an annual figure, our software will allocate one-twelfth of the total amount to each of the 12 months.
For example, if you enter £48,000 in the “total for the year” for Year 1, the software will allocate £4,000 to each of the 12 months leading up to that period.
Using monthly data is useful if you anticipate a material change in the level of revenue or costs at a specific date (seasonality or pre-agreed volume discount for example) - to get a more precise cash flow forecast.
Financial years
In The Business Plan Shop, the financial year always includes 12 months and is defined using the start date entered when creating the forecast (if needed you can change that value in the options).
For example:
- If your forecast starts in January: your financial year will run from January to December.
- If your forecast starts in March: your financial year will run from March to April.
Financial years are formatted using the last month in the period. For example a financial year running from January to December 2022 will be displayed as FY - Dec 22.
It is therefore possible that your forecast’s financial year will be different from your accounting financial year.
That’s OK, using 12 full months for each financial year is a best practice when forecasting as it makes the data between years comparable (which wouldn’t be the case if one year had 3 months and the others 12).
Investors and lenders would rather get an accurate projection using the most up to date information than dates matching your accounting or fiscal year end.
If there are tax implications, for example if your corporation tax bill is based on a different fiscal year end, you can use a custom tax model in the options where you can use a fiscal year end that is different from the financial year end used for forecasting.
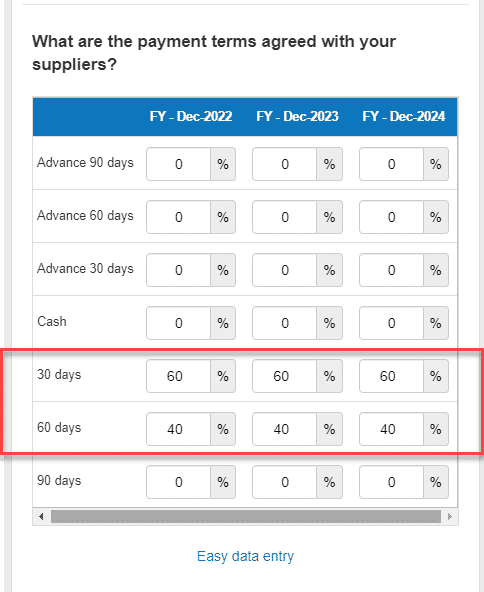
- Firstly, click on the payment terms tab at the top of this page
- Next, you’ll see a two tables
- When are you paid by your clients?
![entering the payment terms that I have agreed with my clients]()
- What are the payment terms agreed with your suppliers?
![entering the payment terms that I have agreed with my suppliers]()
- When are you paid by your clients?
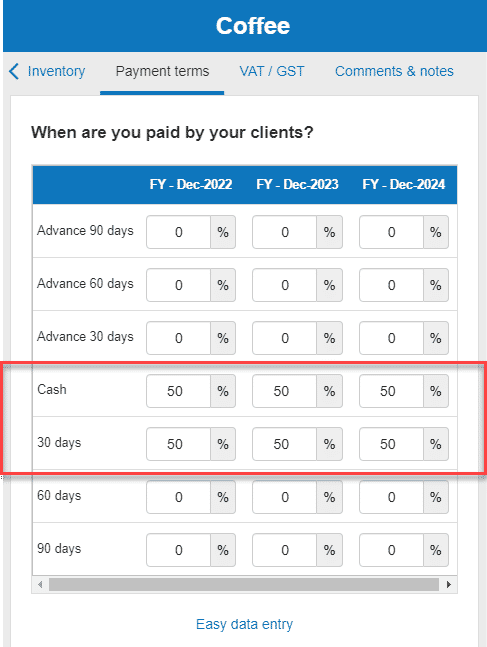
How does our payment table work?
You can forecast the impact of your commercial terms on your cash flow using payment laws.
The table uses the following terms:
- Cash: paid when the goods are delivered or the services rendered (no payment terms).
- Advance XX days: paid in advance (before the goods are delivered or the services rendered). For example, “advance 90 days” means your clients pay you 90 days in advance.
- XX days: paid in credit. For example “90 days” means getting paid by your clients 90 days after the goods have been delivered or the services have been rendered.
The clients' payment terms table ("When are you paid by your clients?") and the suppliers' table ("What are the payment terms agreed with your suppliers?") work similarly. Therefore, we will only explain how the clients' one works below.
The software assumes you send the invoice when the goods are delivered or the services rendered.
By default the table shows up to 90 days in advance or 90 days in credit but this can be increased to 360 days in advance and 360 days credit by clicking the “expand table” button below the table

You can enter payment terms by typing percentages into the allocated text boxes. For example, if you always get paid when you send the invoice, enter 100% into the text box labelled “cash” (cash means upfront in this context, it’s not the payment method)
Multiple payment terms can be used simultaneously. For example, if your clients pay for half of their invoices upfront and the other half in 30 days after receiving the invoice, you should enter 50% into the cash box and 50% into the “30 days” box.
For any financial year the total percentage must equal 100%. If it does not, the software will automatically allocate the remaining percentage to reach 100%. When doing so the software tries to preserve your inputs, so it is possible that the remainder gets allocated in a part of the table not visible on the screen (for example the “360 days” credit field which is only visible when you expand the table)
The table enables you to enter different payment terms for each financial year in your forecast (for a definition of financial years please refer to the: “How do I enter annual or monthly data?” question of this FAQ)
If your payment terms remain constant throughout your forecast, you can use the “Easy data entry” link below the table to copy the value of the first year across to the other years.
Reminder: what are VAT, GST and equivalent sales taxes?
- VAT, GST or equivalent sales taxes are consumption-based taxes that are applied to goods and services.
- There are certain sales thresholds, after which your business must register for VAT, GST or equivalent sales taxes with the government
- Rules vary country by country, but registered businesses are usually able to deduct the sales tax they pay on their costs from the amount collected from customers on their sales
- VAT, GST or equivalent sales taxes don’t impact your P&L statement but they have an impact on your cash flows (as you collect them from your sales when you are paid by your customers, and then later pay the government)
To account for VAT, GST or equivalent sales taxes in your forecast:
Firstly, click on the “VAT / GST tab” at the top of this page:
Notes:
- The tab might also be called VAT if you are using the English GB version of the software.
- If you don’t see the tab, check in the options that the tax has been enabled for your forecast.
Next, you’ll see two tables with the headings “What are the applicable VAT parameters on sales?" and "What are the applicable VAT parameters on production costs?" where you can select the applicable rates and when you wish the tax to become due:
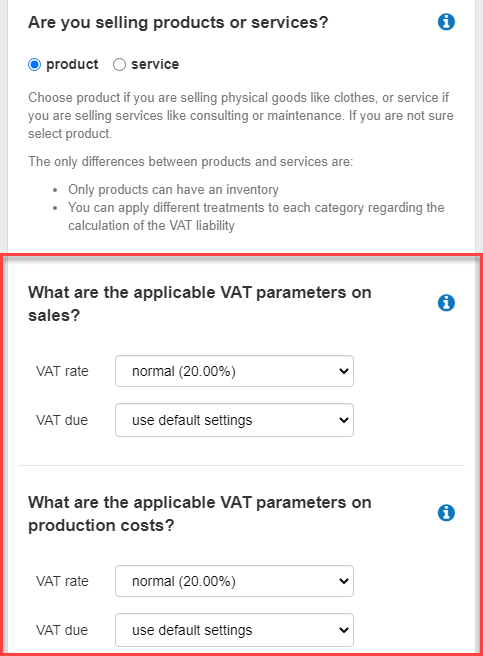
When you are happy with the settings, press the “save and close” button
Notes:
- You can customize the applicable rates in the options
- Rules regarding the recognition (when the tax becomes due) vary country by country, but it’s usually either when the goods are delivered or services rendered (which is what we use as the invoicing date in the software), or when the invoices are paid.
- You can define default rules for product or services in the options, and have the possibility of overriding them here if needed by changing the “Sales tax due” field
- These settings enable you to configure the recognition of the tax, the payment frequency is configured in the options section and applies at the company level.
Classifying your business lines by segment allows you to group your revenues and costs in your forecasted financial statements.
This means that you can breakdown and adjust the level of details when you export your business plan.
To classify your business lines by segment:
- Firstly, click on the settings tab at the top of this page
- Next, scroll down to the bottom of the page and click on “Show advanced parameters”
- You’ll see a text box with the heading “Does this element belong to a segment?
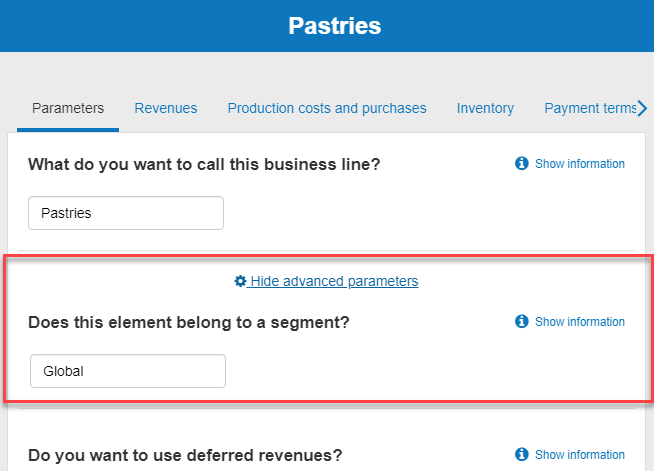
Enter your chosen segment name into the text box given
- If you don't want to use a segment leave the field empty or on “Global”
Finally, press the “save and close” button
Reminder: what are deferred costs?
Deferred costs are an accounting adjustment for goods or services which have been invoiced but not yet delivered or rendered in full.
Deferring the cost enables you to adjust the amount recognized in your profit and loss statement (P&L) so that it includes only the fraction of the goods or services which have been delivered or rendered during a financial year.
Note that this adjustment doesn’t have a direct impact on your cash flow. But it changes the earning before tax in your P&L and therefore affects your corporation tax liability.
Deferred costs are commonly used by businesses that have prepaid expenses. For example, if you purchased an annual insurance premium in September and paid for the year in full during that month:
- In this case, you should only recognize one-twelfth of the amount in your P&L for that month.
- The remaining eleven-twelfths should be recognized in your P&L in the subsequent 11 months (one-twelfth each month for 11 months).
- That way the cost in your P&L for each month will have its fair share of insurance cost.
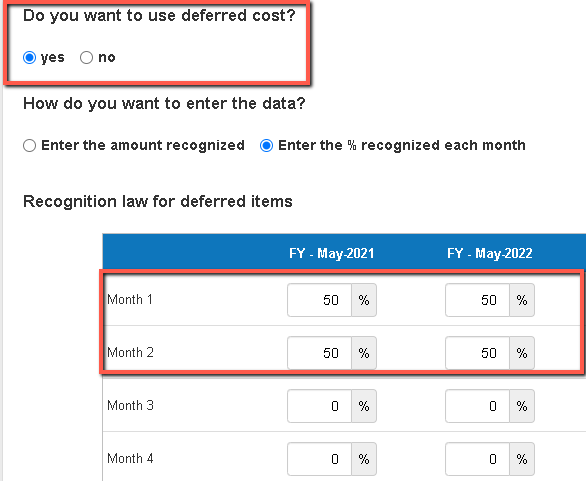
How do I enter deferred costs?
- Firstly, click on the “settings tab” at the top of this page
- Next, scroll down to the bottom of the page and click on "show advanced parameters"
- You’ll see a dropdown menu with the heading "Do you want to use deferred costs?"
- Select yes
- Then choose whether you want to enter the amount recognized or the percentage recognized
![using the deferred costs table to account for prepaid expenses]()
You’ll now see either one of two tables - this will vary depending on which option you have selected - where you can enter your data.
How the deferred costs table works
The table allows you to specify how and when the cost should be recognized for each of the financial years in your forecast. The amount not yet recognized will be deferred.
Enter the % recognized
We recommend that you use a percentage. Entering the amount manually is tedious and should be reserved for specific cases where entering a percentage is not practical.
You can enter the percentage of the total cost that you want to recognize in the P&L for a particular month by inputting data into the “Month” text box.
Month 1 represents the month in which you received the invoice.
For example, if you select 50% in month 1 and 50% in month 2, and have two planned expenses: £4,000 in September and £3,000 in November
- The September invoice will be split as follows in your P&L: £2,000 in September (50% of £4,000 in month 1, which is the month during which the invoice was received) and £2,000 in October (the remaining 50% of £4,000 in month 2, which is the month after when the invoice was received)
- The November invoice will be split as follows in your P&L: £1,500 in November (50% of £3,000 in month 1, which is the month during which the invoice was received) and £1,500 in December (the remaining 50% of £3,000 in month 2, which is the month after when the invoice was received)
Enter the amount recognized
If you prefer not to use a percentage, you can also enter the amount recognized in the P&L directly
In the table:
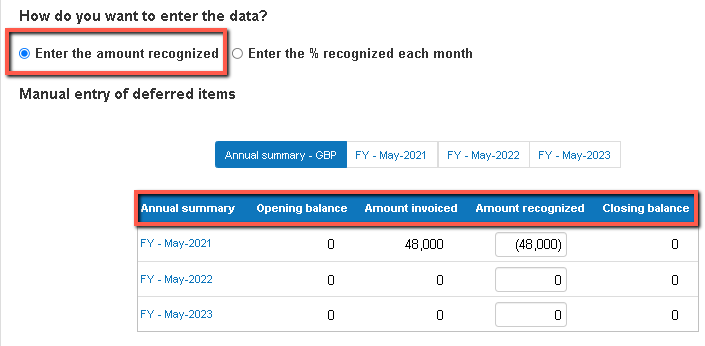
- Opening balance: is the value of the deferred cost on the balance sheet at the beginning of the period.
- Amount invoiced: is the amount that has been invoiced to you (see “How do I enter annual or monthly data?” above in this FAQ).
- Amount recognized: is the amount recognized in the P&L for the period. The maximum amount that can be recognized in the P&L for any given period is the total of the opening balance plus the amount invoiced.
- Closing balance: is the value of the deferred cost on the balance sheet at the end of the period (which will be carried forward in the following month).
Notes
- If you are an accountant, the table behaves at the opposite of what you are used to when entering journal entries: here you need to enter the amount recognized, not the amount deferred.
- The deferred revenues module works the same as the deferred costs module explained above (except it applies to sales instead of purchases).
- To see how to enter data monthly or annually please refer to the explanations in “How do I enter annual or monthly data?” above in this FAQ.
If you sell a product for $100 excluding VAT and make a margin of $25 on it, to convert your margin into a purchase or production cost expressed as a percentage of the turnover, you just have to follow these steps:
- Start by dividing the margin by the turnover to obtain the margin rate: $25 / $100 = 25%.
- To convert the margin into a cost expressed as a percentage of sales, simply do 1 - margin rate: 1 - 25% = 75%.
The cost of goods sold is automatically calculated by The Business Plan Shop software using the data entered in the tabs: sales, cost, and inventory (if applicable) of the business line management module.
You can enter the amount of inventory at the beginning of the plan in the annual summary tab of the inventory section.
If you have chosen to enter the quantity of products manufactured/purchased, you will have to enter both the number of units in stock (in the table) and the inventory value (below the table).
When you choose the option to enter the quantity of products manufactured/purchased to make the stock forecast, The Business Plan Shop software values the stocks using the Weighted Average Unit Cost method (or WAC).
For each period the software computes:
- The average value of a unit in stock = (initial stock in value + total production costs) / (initial stock in volume + quantity produced)
- The cost of goods sold = average value of a unit in stock x volume sold
- Inventory value at the end of the period = beginning inventory in value + total production costs - cost of goods sold
For example, let's say you have:
- An initial stock of 100 units purchased at £2.50 each
- A volume sold and a volume produced of 100 units per month
- A unit production cost of £2,50 the first month then £5,00 the following months stock
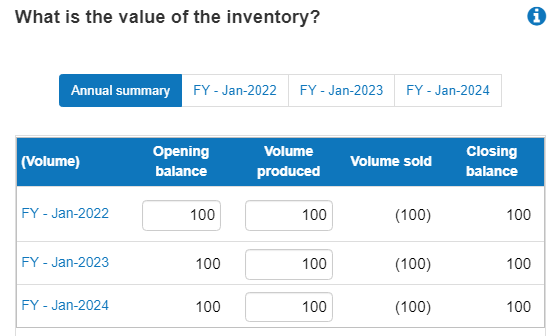
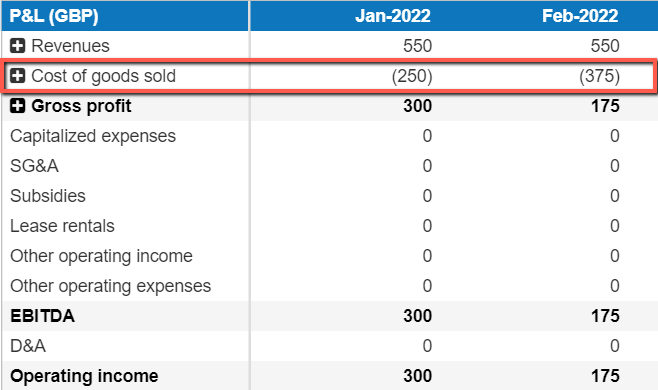
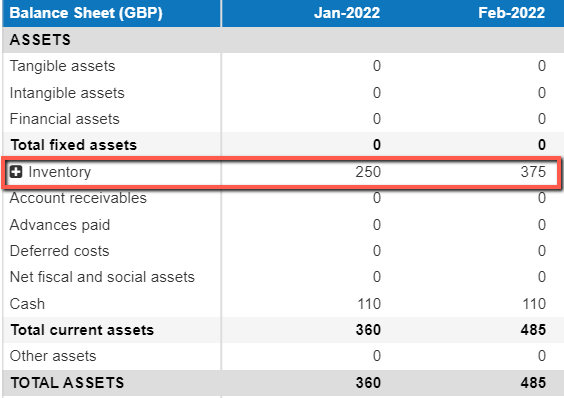
So, in period 1:
- The average value of a unit in inventory = (100 x £2.50 initial inventory + 100 x £2.50 production costs) / (100 units in initial inventory + 100 units produced) = £2.50
- The cost of goods sold = £2,50 x 100 units sold = £250.
- The inventory value at the end of the period = 100 x £2.50 initial inventory + 100 x £2.50 production costs - £250 cost of goods sold = £250
Then, in period 2:
- The average value of a unit in inventory = (£250 initial inventory + 100 x £5.00 production costs) / (100 units in initial inventory + 100 units produced) = £3.75
- Cost of goods sold = £3.75 x 100 units sold = £375
- Inventory value at the end of the period = £250 beginning inventory + 100 x £5.00 cost of goods manufactured - £375 cost of goods sold = £375
Note: If you prefer to enter the value of the inventory at the end of the period directly, you can use the option to enter the inventory value directly.
Go further with The Business Plan Shop
Was this page helpful?